Buckle up, the algos are going to take us for a ride.
Follow @MrTopStep and @BretKenwell on Twitter and please share if you find our work valuable.
Our View
If you have a minute, answer this single poll question:
Someone hit me up on Twitter and said I was “overly bearish.”
Maybe some people think so because I keep talking about the mini-crashes and that there will very likely be a limit-down day in the S&P futures — or at least something that comes close.
I want to respond to that by saying — and I mean this — I hope I’m wrong. Like I always say, no one knows for sure what the S&P is going to do next. The trade has been a giant “whipsaw” based on all the economic and geopolitical strife that I think will get worse before it gets better.
Case in point, Putin just upped his stance on the fight against Ukraine, even though strategists consider it a sign of weakness. And if you think inflation is a US-only problem, check the numbers for Canada and Europe. They’re horrendous. And Europe’s energy crisis could be a major problem when it gets to winter.
So what’s my point?
The S&P can shrug off one or two headwinds. Depending on the landscape, it can even shrug off three or four notable headwinds. But when we have all of these things working against us and a hawkish Fed, well, it’s hard to be that bullish.
As I said, I hope I’m wrong. I’m a bull at heart and so I’m not a big fan of this tape, but it’s the tape we have to work with right now.
Our Lean — Danny’s Take
Today’s Fed Day and it’s going to be a volatile one.
MrTopStep has a rule that you are supposed to fade the first move after the Fed headlines hit the tape. That’s as the algos usually run the stops in both directions before settling down and picking a direction.
On the upside, the levels are clear (and illustrated in the Technical section below). I’m watching 3900 to 3905. Above that, I’m watching the 3922 area. If we clear the 3935 zone, a push toward 4000 may be in store.
On the downside, 3843 to 3853 has been key support for several days now. If this level breaks, it opens the door down toward 3800.
Daily Recap
The ES traded opened Tuesday’s regular session at 3982.75. After the open the ES made several lower lows down to 3859 at 10:37. At 10:42 the ES traded up to 3873.50, dropped down to the 3868 level, double topped above the VWAP at 3984, dropped 8 points, and fell into a big back and fill pattern from 11:19 to 11:51.
The ES rallied up to 3893.25 at 12:06 and then dropped 50 points down to 3843.25 at 1:59. It popped 25 points to 3862.50 at 2:20, dipped 16 points to 3846.50, then rallied 22 points up to 3868.50 in 2.5 minutes.
Ultimately, it ripped 41 points from the 3846.50 low, tagging 3887.50 and trading 3881 at 3:50. The MIM came out with almost $1 billion for sale and the ES traded 3874 on the 4:00 cash close. At the 5:00 futures close, the ES traded 3879.75, down 37.5 points or -0.96% on the day.
In the end, it was a very choppy session. In terms of the ES’s overall tone, there were so many buy and sell programs it was hard to figure out, but the 3850 level did hold again. In terms of the day’s overall trade, volume was high for the size of the trading range at 2.28 million contracts traded.
- Daily Range: 93 points
- High: 3936.25
- Low: 3843.25
Technical Edge
- NYSE Breadth: 13% Upside Volume (!)
- NASDAQ Breadth: 75% Upside Volume
- VIX: ~$27
Game Plan: S&P, Nasdaq
The downside breadth days have been piling up, with three 80%+ downside breadth days in the last six sessions (and one of those was a 95% downside day).
The market is trying to carve out some sort of bottom here, but ultimately its fate will rest with the Fed.
At 2:00 p.m. ET, the Fed will announce its rate hike. Forecasts call for a 75 bps hike, although there’s about a 15% chance the Fed goes with a full point hike.
Currently, the Fed news is like an earnings report. The market doesn’t care about the results as much as it cares about “guidance.” In other words, what is the Fed’s outlook on its rate hikes.
More aggressive or less aggressive? That’s what market participants want to know.
S&P 500 — ES

Yesterday I made the remark that the market just doesn’t feel like it wants to go down, but it hasn’t been able to sustain any upside moves.
I can’t help but notice the strong wicking action out of the 3840 to 3850 area, somewhat similar (but less pronounced) than the action we saw out of the 3740 to 3750 area in July. (hence the “just doesn’t feel like it wants to go down” comment.”
Does that mean we rip? Well…
One thing is for certain: Bulls need to clear 3920 and the 10-day moving average on the upside. Above that could set up a test of the 4000 area.
Bears need to break 3843 to 3855. Below this zone could open the door to 3790 to 3800.
ES — Zoomed In

Above is a 30-minute chart of the ES, going back to late last week.
On the upside, my eyes drift to 3900 to 3905. Not only a key area the last few days, but it’s also the 61.8% of yesterday’s range. Above it puts the 3920 level in play we mentioned above, then 3935.
On the downside, notice how ~3850 has been solid support.
I imagine the stops just beyond both zones are beginning to build.
SPY

We need some sort of resolution from this three-day range.
$382 has been key support, while $386, then $388.50 has been resistance.
The larger upside level to me is ~$390. That’s the line in the sand. Below and the “benefit of the doubt” goes to the bears. Back above it and it starts to shift toward the bulls. The latter really needs to reclaim this level and the 10-day moving average.
Nasdaq — QQQ

$290/$291 has been clear resistance while $286 has been support.
Guys & gals, it’s pretty simple: We need a break of the three-day range. When we get it, we’ll know which direction to go in.
CHNG
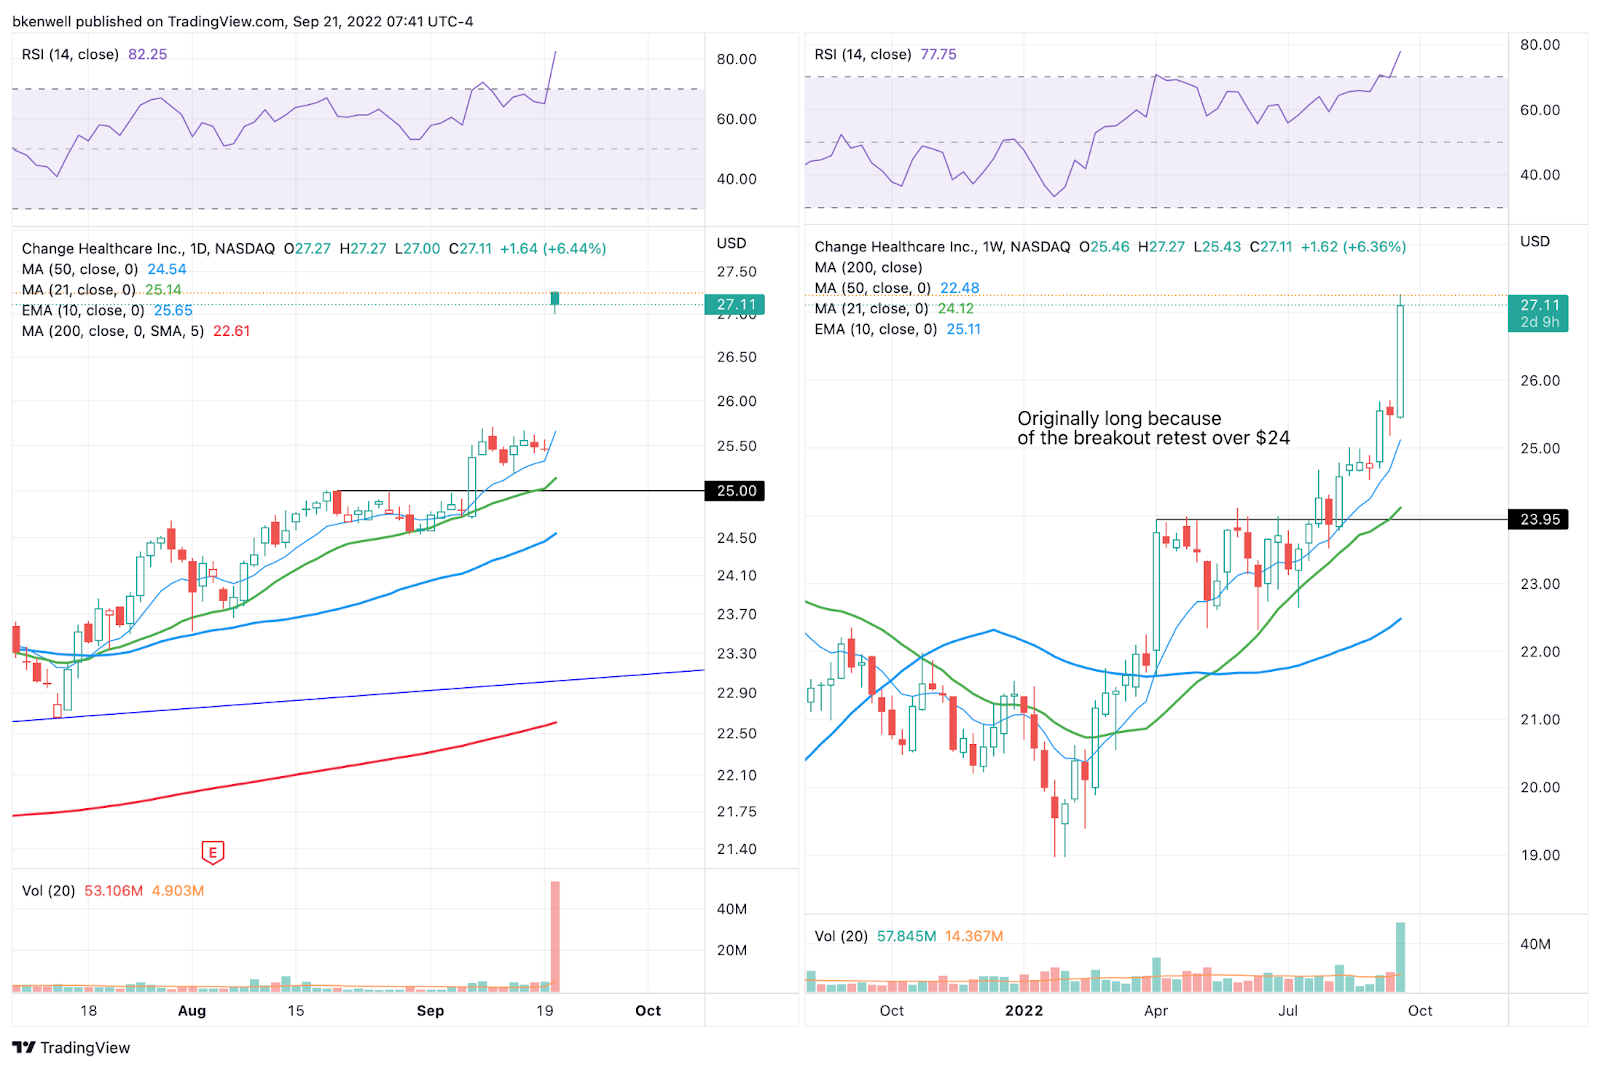
Looking for $26 on the last chunk of our trade in CHNG, I closed out the rest of my position yesterday on the gap-up to $27.
While this is certainly a stroke of luck, I want to highlight something more important.
Notice how well this stock held up during the corrective phase in the market. It remains in a breakout state and above active support, (the 10-day ema). The trend and technicals remained healthy when the state of the market was not healthy.
That kept us in it and that led to yesterday’s big pop.
Keep that in mind going forward with other holdings.
Go-To Watchlist — Individual Stocks
*Feel free to build your own trades off these relative strength leaders*
- Numbered are the ones I’m watching most closely.
- Bold are the trades with recent updates.
- Italics show means the trade is closed.
Notes:
- UUP — Down to ¼ position as we hold for potentially higher prices. Raise stops to $28.40 to $28.50. Look for $30 on the last piece.
- CHNG — Consider taking the last piece off at $25.75 to $26 or simply hold against a B/E or better stop and ride the trend higher. #Kudos
Relative strength leaders →
Top:
- TAN
- ENPH
- FSLR
- LNG
- TSLA
- CAH
- ALB
- VRTX
- F
- CYTK
- XLU
- XLE
- BMRN (weekly/monthly)a
- PWR
- CHNG
- CELH
- UNH
Economic Calendar

Comments are closed