The Bank of England blinks; AAPL falls 3%.
Follow @MrTopStep and @BretKenwell on Twitter and please share if you find our work valuable.
Don’t Forget: We recently noted the long-term performance of the S&P 500 (and what that means for investors and traders), and we also took a look at some longer-term setups for those interested.
Our View
I would like to say this is going to get easier, but I don’t think it will. At least not immediately. The algos have completely taken over and because volatility is so wide, so are the trading ranges. It’s not just ticks anymore, we’re moving in 5 or even point clips sometimes. If you hesitate or can’t decide, 20 or 30 points could go by in less than a minute.
Yesterday’s action was ugly. In the technical section, we wrote:
My concern is: Gapping-up in a bear tape and just to get to the daily-up spot, the ES has to climb 1.6%. That’s a big move.
About the worst thing bulls could see happen, would be a higher open like this, a tag of the highs and a flush to take out the two-day low around 3660.
That’s what happened, but after we took out the low, the markets bounced and the S&P closed back within (or near) the two-day low. That creates some conflict on the charts. Essentially, did we just get a “kick save” after making new lows and we’re back within the range (and quite oversold) or is more trouble lurking?
Our Lean — Danny’s Take
On Monday, we warned about the PitBull’s rule, which says the S&P rallies early in the week and early in the day while in a bear market — that has been right-on recently.
Every rally has failed, the ES is not only down in 5 of the last 6 weeks, it’s also down 6 days in a row and it’s the longest losing streak since February 2020. Pretty incredible, right? Even with those horrendous losing streaks earlier in the year, the S&P never strung together 6 down days in a row this year.
We all know when you get extended selloffs like this, the odds of a bounce are high…but the tone just feels like a big liquidation trade. I don’t know how to describe it, but “disjointed” is all I can think of. The move in bonds, bond spreads, and currencies is unnatural and while the S&P has been going down, it almost feels tame compared to the other assets. That’s concerning and reassuring all at the same time.
Despite the NQs higher close yesterday, it was up 252 points at its high and fell 335 points to its low, and finished higher by just 17 points.
While some tech stocks seem to be holding up better than others, there is no doubt higher interest rates are weighing on the Nasdaq. The other part of this is the ‘continuous’ MOC selling. I am going to ask Marlin how to total up the last 6 weeks of MOC and get a net for the dollar amount. Until that stops, the S&P will not make a low.
Is the ES going to 3000 as the PitBull speculated? I don’t know, but I think ES 3450 would be my first real downside support level then 3300, 3100, 3000.
Our lean is we cannot rule some rips, but we still think you sell the bigger rallies. Lastly, a lot of the selling has been tied to the end of Q3 rebalance. A bounce is in order, but the question is will it hold?
Daily Recap
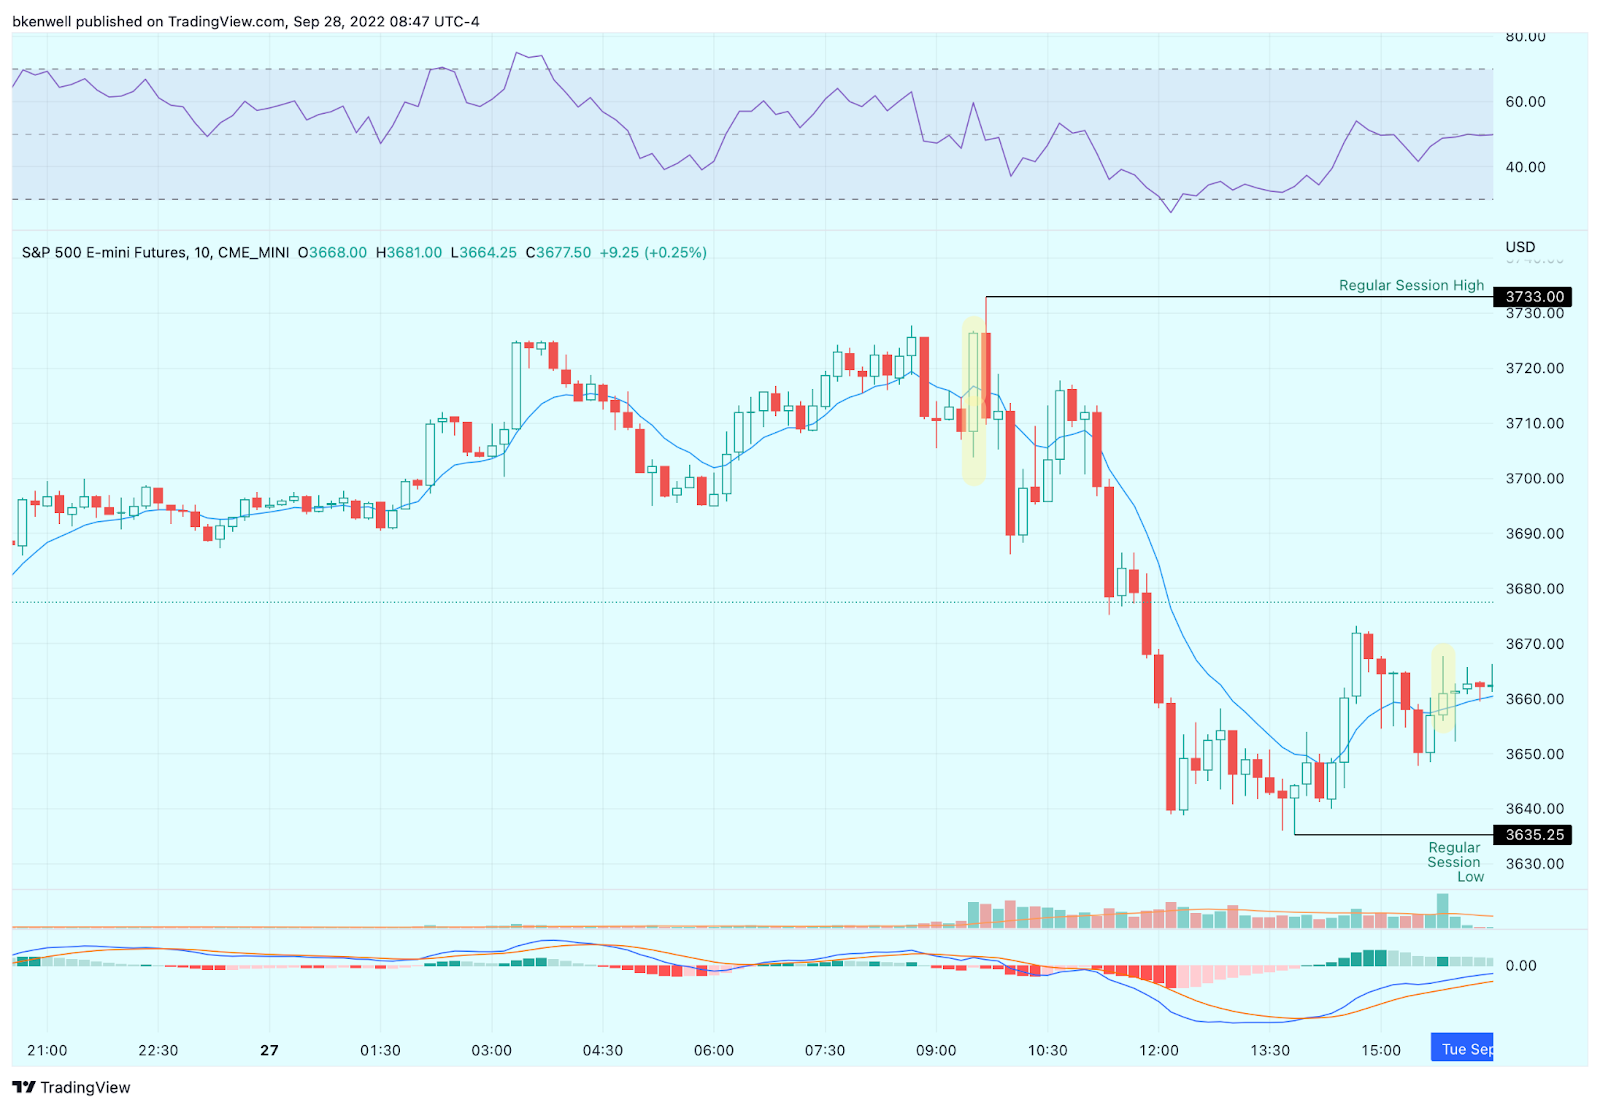
The ES did exactly what it did yesterday, it blasted higher after the open up to 3733 at 9:41 and then got pounded. We pondered a Turn Around Tuesday but most of the rally was on Globex and the first 15 minutes of the session as the ES traded 3686.25 at 10:09. The ES rallied all the way up to a lower high at 3717.75 at 10:47 amd then sold off down to 3678.25 at 12:20. The ES rallied back up to the 3658 are at 1:01, traded in a 15 handle back and fill then dropped down to 3635.25 at 1:56 and then rallied up to 3673.25, sold back off down to the 3655.00 level at 3:17 and then traded down to at 3:39.
The ES traded 3660.25 at 3:45, traded 3656.25 as the 3:50 cash imbalance showed $1.5 billion to sell, and traded up to 3668 area at 3:55 and traded 3660 on the 4:00 cash close. After 4:00 the ES traded up to 3665.75. and settled at 3665.25 on the 5:00 futures close, down 9 points or 0.25% on the day.
In the end, it was a chop-shop down to a new 2022 contract lows and then the push back up to close above 3660. In terms of the ES’s overall tone, it was the same as the day before and the day before that and so one and so on. In terms of the ES’s overall trade, the volume has been cranked up, with total volume of 2.9 million contracts on Tuesday.
- Daily Range: 97.7 points
- High: 3733
- Low: 3635
Technical Edge
- NYSE Breadth: 52% Upside Volume
- NASDAQ Breadth: 60% Upside Volume
- VIX: ~$34
Game Plan: S&P, Nasdaq
Bonds nearly closed on the lows yesterday (the TLT), while the dollar continues to thump higher.
The Bank of England blinked this morning and is going on a short-term bond-buying spree. That has the pound back under pressure and the dollar index rising again. Bonds are hardly up this morning, with the /ZB flat and the TLT up 0.1% as of 7:50 a.m.
If bonds bottom and the dollar retreats, I will expect the S&P to rally. When this will happen, I don’t know, and how far that rally goes remains to be seen.
But if you don’t already, I would suggest keeping bonds and the dollar up on your screen (TLT and/or ZB, along with DXY and/or UUP work fine), as well as AAPL and maybe TSLA — two stocks that have been relative strength leaders amid the recent turmoil.
- Apple is down 3% in the pre-market, so today will be a good test.
If the market loses Apple, it will lose and amid the chaos and complexity, sometimes it feels as simple as that.
S&P 500 — ES

On the left is the daily chart, on the right is the weekly chart.
You can see where a push lower may find support on the weekly chart, in that 3500 to 3575 area.
On the daily, resistance has been obvious too, in the 3730 to 3745 zone. If we rally back through 3700 and hold above this level, then this zone is paramount. Active resistance is near the 10-day moving average.
If we see this zone, I will treat it as resistance until proven otherwise.
3660 is the line in the sand. The ES either needs to reclaim this level to open up more upside, or it may serve as resistance. If we can’t reclaim this area, then 3640 is in play, followed by the Globex low at 3613.
Just because we’re oversold doesn’t we can’t become more oversold.
ES — Zoomed In

Looking at the H4 chart above, the ES is struggling with active resistance via the 10-ema, while also trying to reclaim last week’s low (the dashed line) and the prior two-day low near 3660.
That’s why I referenced this area as the “line in the sand” earlier.
If it can be reclaimed and maintained, it puts the Globex high in play near 3675, then 3700+.
If it can’t be reclaimed, then the 3636 to 3640 area is in play, followed by 3613.
Level to level — and no shame for sitting out with VIX $30+. Mental capital is a thing.
SPY

#KISS as we now have a three-day range to work with.
Above $370.60 is constructive, below $363 is destructive.
Below $363 and we have to watch the June low and yesterday’s low of $360.87.
Nasdaq — NQ

Concern sits with the fact that the NQ is almost deliberately closing below the 11,350 to 11,380 zone. Notice how it continues to hold the 161.8% downside extension tho, but has not tested the June low of 11,157.
It’s consistently been rejected by the 11,550 area, so keep an eye on that if we push higher in an oversold bounce. For now, the 10-day remains active resistance. If we push through both areas, 11,775 to 11,800 is potential resistance.
On the downside, the charts do not look constructive below 11,230. Below that keeps Tuesday’s low in play.
QQQ

Just like SPY, try to keep the QQQ simple.
Above $280 puts the 10-day in play, then $286.
On the downside, a break of $272 (where the QQQ finds the 200-week moving average) could open up more downside.
Go-To Watchlist — Individual Stocks
*Feel free to build your own trades off these relative strength leaders*
- Numbered are the ones I’m watching most closely.
- Bold are the trades with recent updates.
- Italics show means the trade is closed.
Notes:
- All done with the UUP/DXY dollar trade for now. Currencies are getting volatile and we want to book our gains and hold tight.
Relative strength leaders → Again, With the VIX at $30+ I am not looking at many individual stocks at this time. My long-term setups are here. My top relative strength leaders are here.
Top:
- ENPH — holding the breakout near $269
- LNG — nearing the breakout near $150
- MCK — holding the breakout near $340
- CAH — holding the breakout near $64 and the 50-day/10-week moving averages
Here’s a quick look at the stocks above (in the Opening Print Twitter Community).
- FSLR
- TAN
- ALB
- TSLA
- VRTX
- CYTK
- XLU
- XLE
- BMRN (weekly/monthly)
- PWR
- CHNG
- CELH
- UNH
Economic Calendar
A lot of Fed Speak Today:

Comments are closed