A relatively quiet week in terms of earnings and econ reports.
Follow @MrTopStep and @BretKenwell on Twitter and please share if you find our work valuable.
Don’t Forget: The Long-term performance of the S&P 500, some longer-term setups, and 5 red flags that showed up before the 2022 bear market.
Our View
While I mainly follow the ES, I also follow the YM (Dow futures). I have posted about it before, but the YM never got beared up like the ES and NQ. If you look at a chart, you’ll notice it’s trading much better too.
The YM’s year-to-date advantage over the ES is the largest since 1933. At its low, the YM traded down to 28,635, and last week’s high, it hit 34.707. On April 21 the YM was at 35,400 and on the same day in April, the ES was at 4510. What I am saying is, the Dow is almost back to where it was in April and the ES is at 4100, almost 400 points lower than where it was in April. Usually, it’s the ES that outperforms the Dow.
As of Friday’s close, the Dow is down 5.3% for the year, which is pretty damn good compared to the ES which is down 15%, and the NQ which is still down a whopping 27% YTD. Between the NQ and ES, the Dow is the only one not in a bear market and many on Wall Street think the Dow will continue to outperform in 2023. Also, inflows into funds that track the Dow are seeing the highest net inflows in the first 10 months of the year since 2017.
Our Lean — Danny’s Take
If the ES is going higher it’s going to need some sell-offs and some back-and-fill. And even if it does go higher, we have to be on the lookout for some negative headlines that the news algos can exploit.
I have always known it from the trading floor, but @realTraderDave has taught me to be patient with those types of drops before buying them. That said, we have a somewhat quiet week on the economic and earnings front.
There are some interesting, but no significant earnings reports until Thursday, when we hear from Costco, Lululemon, and Broadcom. Today we’ll get an ISM at 10 a.m. ET and on Friday we’ll get a PPI number at 8:30.
Next week is when we get the CPI print and the Fed’s rate decision. As the month wears on, more and more people will be cutting back on their trading — it actually feels that way now.
Our Lean: Sell the early rally and buy the pullbacks.
Don’t be in a rush to make a million trades on Monday morning. Let the action come to you. On the upside, keep an eye on 4075 to 4085, then 4110.
On the downside, 4050 is key, then 4000 to 4007. Below 3990 could open the door back down to 3950.
MiM and Daily Recap

The ES made a high at 4084.50 on Globex and sold off down to 4012.25 after Friday’s jobs report and opened at 4028.50. After the open, the ES traded up to 4047.75 and then sold off down to 4030.75 and then traded up to 4054 at 10:15. The ES pulled back to 4039 at 10:30 and then rallied up to 4058.50, 2 ticks above the previous high, sold off under the VWAP at 4042.50 and then rallied up to 4070.00 at 12:19.
It traded up to 4085.50 at 3:20 then sold off down to 4072.50 at 3:30.The ES traded 4067 as the 3:50 cash imbalance showed $410 million to buy and traded 4075 on the 4:00 cash close and settled at 4066.75 on the 5:00 futures close, down 10.75 points or -0.36% on the day.
In the end, the best trade of the day was short into the jobs number, and the rest of the day was a grinding short-covering rally. In terms of the ES’s overall tone, there were a lot of bids on the way up to the late-day high. In terms of the ES’s overall trade, volume was lower at 1.78 million contracts traded.
Technical Edge
- NYSE Breadth: 60% Upside Volume
- Advance/Decline: 53% Advance
- VIX: ~$20.15
The market did a great job rallying off support on Friday. Coming into Monday, we’re back under pressure again though.
We keep trimming into the upside rallies and raising our stops to B/E or better. It’s imperative to take profits along the way and “pay ourselves” for the risks taken.
S&P 500 — ES

On Friday, we had a huge reaction off the 4006 area and the 10-day moving average. However, bulls would ideally like to see the ES hold above the 4050 area and the 200-day moving average.
That’s been a key level of multi-week highs, as well as the 200-day moving average.
If the ES breaks below this area, it opens the door back down to Friday’s low and the 10-day. If we break 3990, then the 3940 to 3950 zone is back in play.
On the upside, keep an eye on 4075. Above it puts 4085, then 4110 in play.
SPY — Daily

The market ripped higher on Nov. 10, consolidated sideways and burst higher on Wednesday Nov. 30.
Does it need another round of consolidation after Wednesday’s burst and Friday’s BTD action? I don’t know. For the week, the SPY gained just 1.1%. If it wants more upside, keep an eye on $407.85 and $410. That’s Friday’s high and last week’s high, respectively.
If bulls take control, they will rotate over these levels, putting the $413 to $414 zone in play.
On the downside, bulls must defend Friday’s low and the 10-day moving average. A break below could put the $393-ish area on tap.
TLT
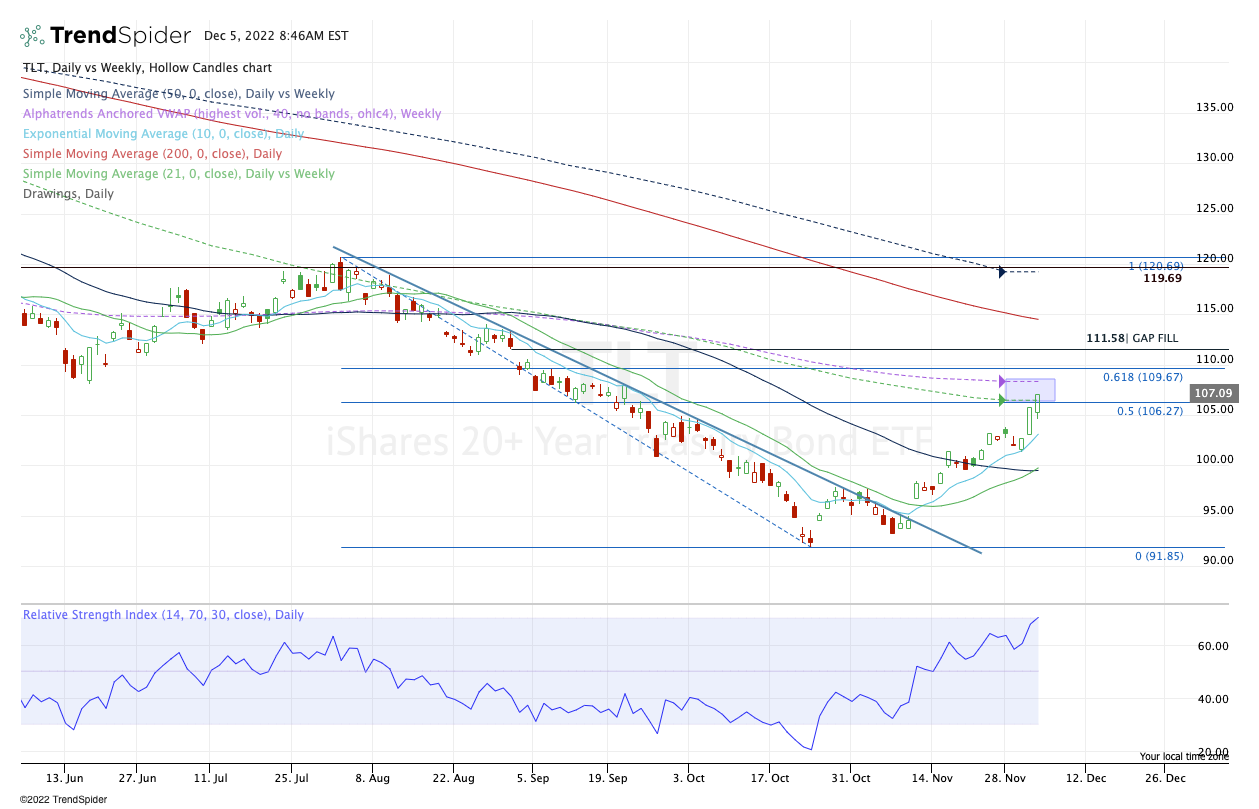
I like the idea of another trim into the weekly vWAP measure, currently at $108.33.
Go-To Watchlist
*Feel free to build your own trades off these relative strength leaders*
- Numbered are the trades that are open.
- Bold are the trades with recent updates.
- Italics show means the trade is closed.
Open Positions —
- TLT — Long from ~$97, reloaded at $101.50, trimmed down to ⅓ to ½ position.
- CCRN — down to ⅓ or less. Exit at $36+ or consider holding for $37.50 to $38. Stop raised to $34.
- DIA — Reloaded on the daily-up over $339.37. Let’s fish for $349 to $350 before the next trim.
- Inch stop up to $34.
- TJX — Long from ~$79. Trim at $81. Stop at $78.50 (No need to let it unravel too far against us). Great reaction from the 10-ema.
- IBM — Daily-up over $147.17 was the entry. $145.50 is our stop. Trimming ⅓ at $149.50+ (pre-market is fine). Ideally down to ½ if we see new highs over $150.50.
- Stop at $145.50 or B/E for less aggressive traders
- WMT — Long from $151. Trimmed ⅓ at $153.25. I am going to say B/E stop and trim down to ½ if we see $154+
Relative strength leaders →
- LNG
- CAH
- Retail — TJX, WMT, ULTA
- SBUX
- DE
- CCRN
- AMGN
- MET
- GIS
- REGN
- CI
- MCD
- ENPH, FSLR — solar has strength
- VRTX
- UNH
- MRK
- XLE — XOM, CVX, COP, BP, EOG, PXD (Weekly Charts)
Economic Calendar

Comments are closed