Markets were trashed again yesterday.
Follow @MrTopStep and @BretKenwell on Twitter and please share if you find our work valuable.
Don’t Forget: The Long-term performance of the S&P 500, some longer-term setups, and 5 red flags that showed up before the 2022 bear market.
Our View
I have been right about selling the rallies this week, but wrong about buying the pullbacks. The sell programs that have hit the markets over the last few days have been oversized and tied to year-end tax and fed-rate hike jitters. Everyone thinks December is a big up month, but that’s not the whole story.
It does tend to be a good month for stocks. However, it’s limited to a few bursts, followed by a lot of chop. The best part of the rally is the Santa Claus rally that happens in the final 5 days of the year.
Tax-loss selling is the process of selling stocks at a loss in order to reduce the capital gains earned on an investment. Since capital losses are tax deductible, these losses can be used to offset capital gains and reduce an investor’s tax liability on their tax return. This has been a big part of the weakness in December and while stocks may rally, the tax-loss selling goes on right into the end of the year. And there are plenty of losers to dump this year!
The idea or strategy is to sell the loser while buying another stock, but a lot of people may just sell the losers this year.
Our Lean — Danny’s Take
This week was supposed to be a quiet week. No major econ reports or earnings. Next week we have the CPI report, the FOMC rate hike, and quad-witch expiration. Yet this week so far has been full of nasty cross-currents.
There is clearly anxiety about the upcoming rate hike, but I am still looking for the PitBull’s Thursday-Friday low the week before expiration — so tomorrow and Friday. It’s a high percentage that I am going to be talking to @realTraderDave about some type of option like lotto calls to buy along with my regular futures trade.
As for today, the ES held above 3900 — and for now, the key 3920 level — so it’s hard for me to go full-on bear, especially after a 188-point drop over the last 4 days, with 152 of those points coming in the last two days.
Our Lean: I’m not sure the selloff is over, but I’m looking to buy the dip as yesterday’s breadth numbers did improve notably over Monday’s and the decline is itching for a bounce after several days of declines.
MiM and Daily Recap

The ES traded up to 4014.50 on Globex and opened Tuesday’s regular session at 3999.75. After the open, the ES rallied up to 3905.50 and then sold off down to 3953 at 10:41. The ES rallied up to 3966.25 and then dropped down to 3921.50 at 2:38 and rallied up to 3938 at 3:03. Yes, there were a few 5 and 10 point rallies along the way but every one was sold.
The ES traded 3944 as the 3:40 cash imbalance showed $1.3 billion to buy and traded 3945.50 on the 4:00 cash close. After 4:00, the ES traded in a narrow range and settled at 3945 on the 5:00 futures close, down 58 points or down 1.45% on the day.
In the end, the selling that started last Friday carried through into Monday and Tuesday. In terms of the ES’s overall tone, it was weak. In terms of the ES’s overall trade, volume was above average at 1.8 million contracts traded.
Technical Edge
- NYSE Breadth: 32% Upside Volume
- Advance/Decline: 28% Advance
- VIX: ~$23
Breadth did not confirm it, but yesterday was a messy, messy session. Stocks took it on the chin even as rates fell and the dollar only climbed modestly. At one point though, the dollar was down and stocks still couldn’t fetch a bid.
I was on the wrong side and I took 3 straight losses yesterday, which is unusual. I have a trading rule that says if I take three straight, it’s into the penalty box for me — AKA done trading for the day.
Some days are like that. We combat those defeats by keeping our position sizes small. It protects our account, but just as importantly, it protects our mental capital as well. Yes, it sucks, but that’s trading and those days happen. You need to have safeguards built into your plan to account for days/stretches like that.
S&P 500 — ES

The ES is back under pressure this morning. I like that it’s holding 3920. That’s a key pivot.
But I don’t like how it effortlessly cut through the 10-day and 21-day moving averages or how it’s getting stuck below last week’s low at 3941.
Bulls need to reclaim that low. Otherwise, I can’t rule out the 50-day near 3835 or the 50% retrace at 3806.
On the upside, I expect resistance at 3980. That’s if the ES can clear 3955.
SPY — Daily
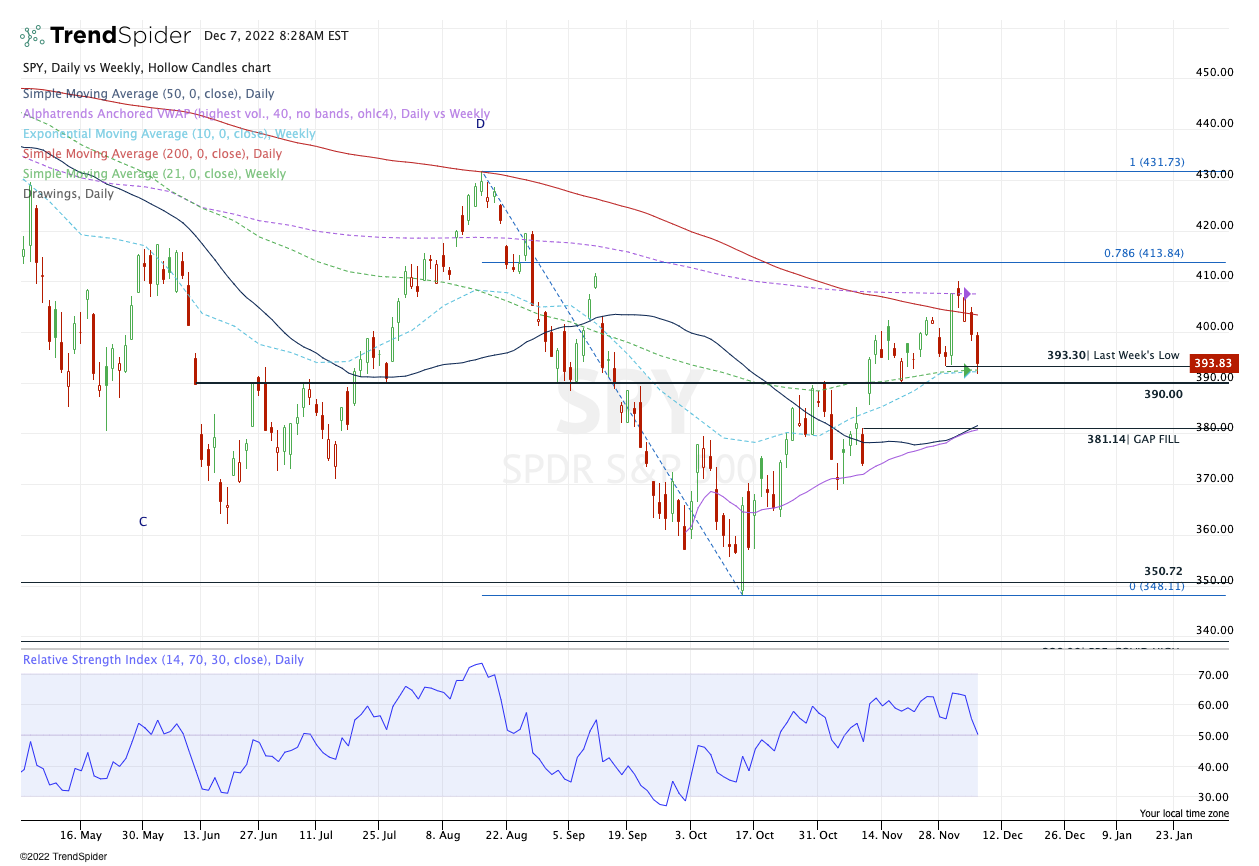
The $393s held by the close yesterday, but not in convincing fashion. This chart is messy.
I want to see if the SPY can hold yesterday’s low, which comes into play at 10-week and 21-week moving averages. If it can’t hold, I do believe we see $390.
If it can dance around the low — at $391.64 — maybe we can get some kind of reversal to brew. The true pivot, IMO, is last week’s low of $393.30. If we get stuck below this, odds start to favor more downside.
If the low holds, maybe we can see $398 to $400 on a bounce.
(I also can’t help but notice that open gap down at ~$381, if the selling pressure does pick up over the next days/weeks).
Nasdaq — NQ

Daily on the left, weekly on the right.
The NQ failed at the 21-week moving average and the 50% retracement of the larger range. Now it sits just above last week’s low at 11,465. Keep an eye on this, as well as yesterday’s low near 11,500.
If the NQ can’t stay above these levels, it puts the overnight low in play at 11,422. That low comes into play at the 50-day and 200-week moving averages.
Listen to the market when it speaks. If bulls are in control, they will hold these measures. If they are not, they will break, and 11,315 will be back on the table.
On the upside, see how the NQ handles 11,596 — the Globex high. Above that puts 11,700 in play.
Go-To Watchlist
*Feel free to build your own trades off these relative strength leaders*
- Numbered are the trades that are open.
- Bold are the trades with recent updates.
- Italics show means the trade is closed.
Open Positions —
- TLT — Long from ~$97, reloaded at $101.50, trimmed down to ⅓ to ½ position. Looking to trim down to ⅓ to ¼ if we see $108 to $108.50.
- TJX — I trimmed ½ of TJX yesterday at $81, a little more than usual. ⅓ is okay. Go with a B/E stop here.
- IBM — Daily-up over $147.17 was the entry. $145.50 is our stop. Trimming ⅓ at $149.50+ (pre-market is fine). Ideally down to ½ if we see new highs over $150.50.
- Stop at $145.50 or B/E for less aggressive traders (B/E Stop hit)
- CEG — Long from $90 Yesterday, ½ size. Stop at $86. Looking to trim at $93 to $94.
- Ulta — Long from 406.50 yesterday, ½ size. Can trim ¼ at $465 but really looking for $470 to trim. Stop at $457.
Relative strength leaders →
- LNG
- CAH
- Retail — TJX, WMT, ULTA
- SBUX
- DE
- CCRN
- AMGN
- MET
- GIS
- REGN
- CI
- MCD
- ENPH, FSLR — solar has strength
- VRTX
- UNH
- MRK
- XLE — XOM, CVX, COP, BP, EOG, PXD (Weekly Charts)
Economic Calendar

Comments are closed