Our View
I
Yesterday I had the “sell the rallies” part right, but I had the “buy the weakness” part wrong.
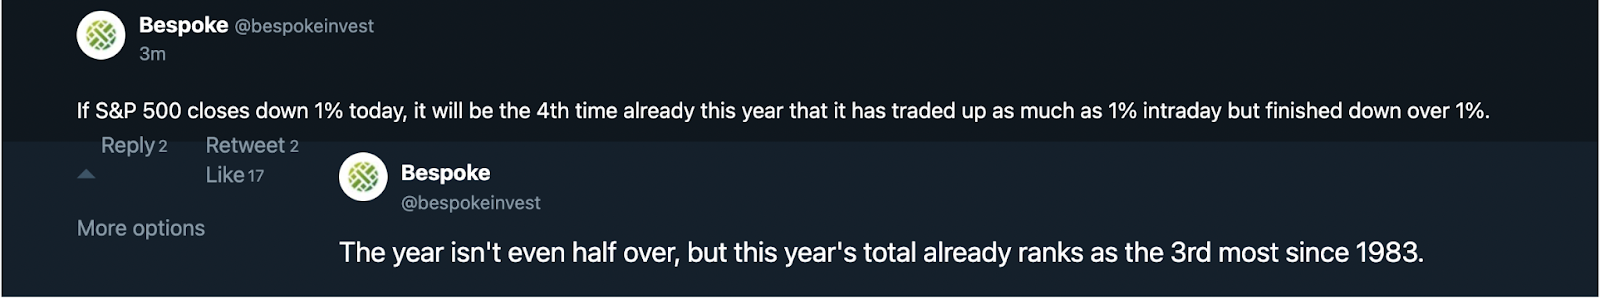
According to Bespoke, yesterday was the fourth time this year that the S&P traded up as much as 1%, but finished down over 1%. This year isn’t even half over yet and this already ranks as the third most since 1983.
Regardless of the lower volumes, volatility continues to be high. For those who either know me personally or have been long-time readers, you know that in my heart I’m a bull. The numbers back up the bull case, but so does my outlook on life.
Despite this, coming into this year I said the S&P 500 will pull back by 15%, and oil will go to $120. Once the pullback began, it was clear it wasn’t like other corrections. So while everyone was trying to buy the dip, I couldn’t help but think it just looked too disjointed.
So I’m sorry if I just seem like a broken record at times, but I’ve watched this index for more than 40 years and when it talks, I listen. And then I write it here — even if it’s not what everyone wants to hear.
Our Lean
The S&P showed how quickly things can change. Just after the open, the ES rallied quickly up to 3950 — two points above Monday’s high. It could not have looked better, but the NQ was weak and then the consumer confidence number showed consumers’ short-term outlook for the U.S economy dropped to its lowest point in nearly a decade. That was all the Nasdaq needed to hear. Right after the release, the NQ began to tumble and the sellers had exactly what they needed: A catalyst.
This is a prime example of how a bear market operates: Rally early in the day and early in the week, then fail.
I do not have a good feeling about the end of the quarter rebalance. Even if it is up in the first part of the day, I don’t think it will hold going into the later parts of the day when the MIM comes out big for sale.
Halfway back from the 3950 high to the 3822 low is about 60 points or 3886. My lean is to sell the rallies, especially if the ES sees the 3885 to 3895 area. On the downside, keep a close eye on yesterday’s low. A move below that could flush out more longs and put 3800 in play.
Daily Recap
The ES opened Tuesday’s regular session at 3920.25, traded 3919, and then rallied almost ~30 points up to 3947.50 in 7 minutes. After a few point drop, the ES traded up to 3950 shortly before 10, while breadth was aggressively on the bull side.
Then it reversed and the buyers never stepped in.
The ES sold off all the way down to 3874 after the consumer confidence number missed estimates and showed that we could be heading into a recession. After a few small bounces, the ES sold off down to 3851 just after 12:00. After another minor bounce, the ES sold off all the way down to 3825, 125 points off the high of the day.
The ES found its footing in the 3825 to 3835 area and traded 3828.50 as the 3:50 cash imbalance showed $1.51 billion to sell. That drove the ES down to a new low at 3823 and it traded 3825.25 on the 4:00 cash close. It settled at 3928 on the 5:00 futures close, down 81 points or 12.10% in the day.
In the end, yesterday was a good lesson in economics. The sharp rise in consumer credit is a clear sign the US economy is either in a recession or on the cusp of one. In terms of the ES’s overall tone, the NQ was clearly where the selling originated from. In terms of the ES’s overall trade, volume was still below average at 1.73 million, but the highest reading since June 17.
- Daily Range: 128.25 points
- H: 3950
- L: 3821.75
Technical Edge
- NYSE Breadth: 25% Upside Volume
- NASDAQ Breadth: 32% Upside Volume
- VIX: ~$29
Coming into this week, it “felt” like they wanted to push the market higher. The pieces to the puzzle fit, as we were coming into the EOQ rebalance, were due for an oversold bounce, sentiment was in the toilet and the seasonal stats were very bullish.
However, yesterday I noted that the bond performance was not inspiring. Why were bonds rolling over the last few days when stocks were not? This was a concern because they have been highly correlated this year.
Talking with a friend over the weekend, I was a bit more relieved to see a nice rally in the Semiconductors — but that was a one-day move and now it also concerns me. We’ve talked about it here before, but I like to view the semis as a leading indicator. To see them lagging the indices is not promising.
Game Plan — S&P 500 (ES & SPY), Nasdaq (NQ), Oil, XLE, Dollar
S&P 500 — ES
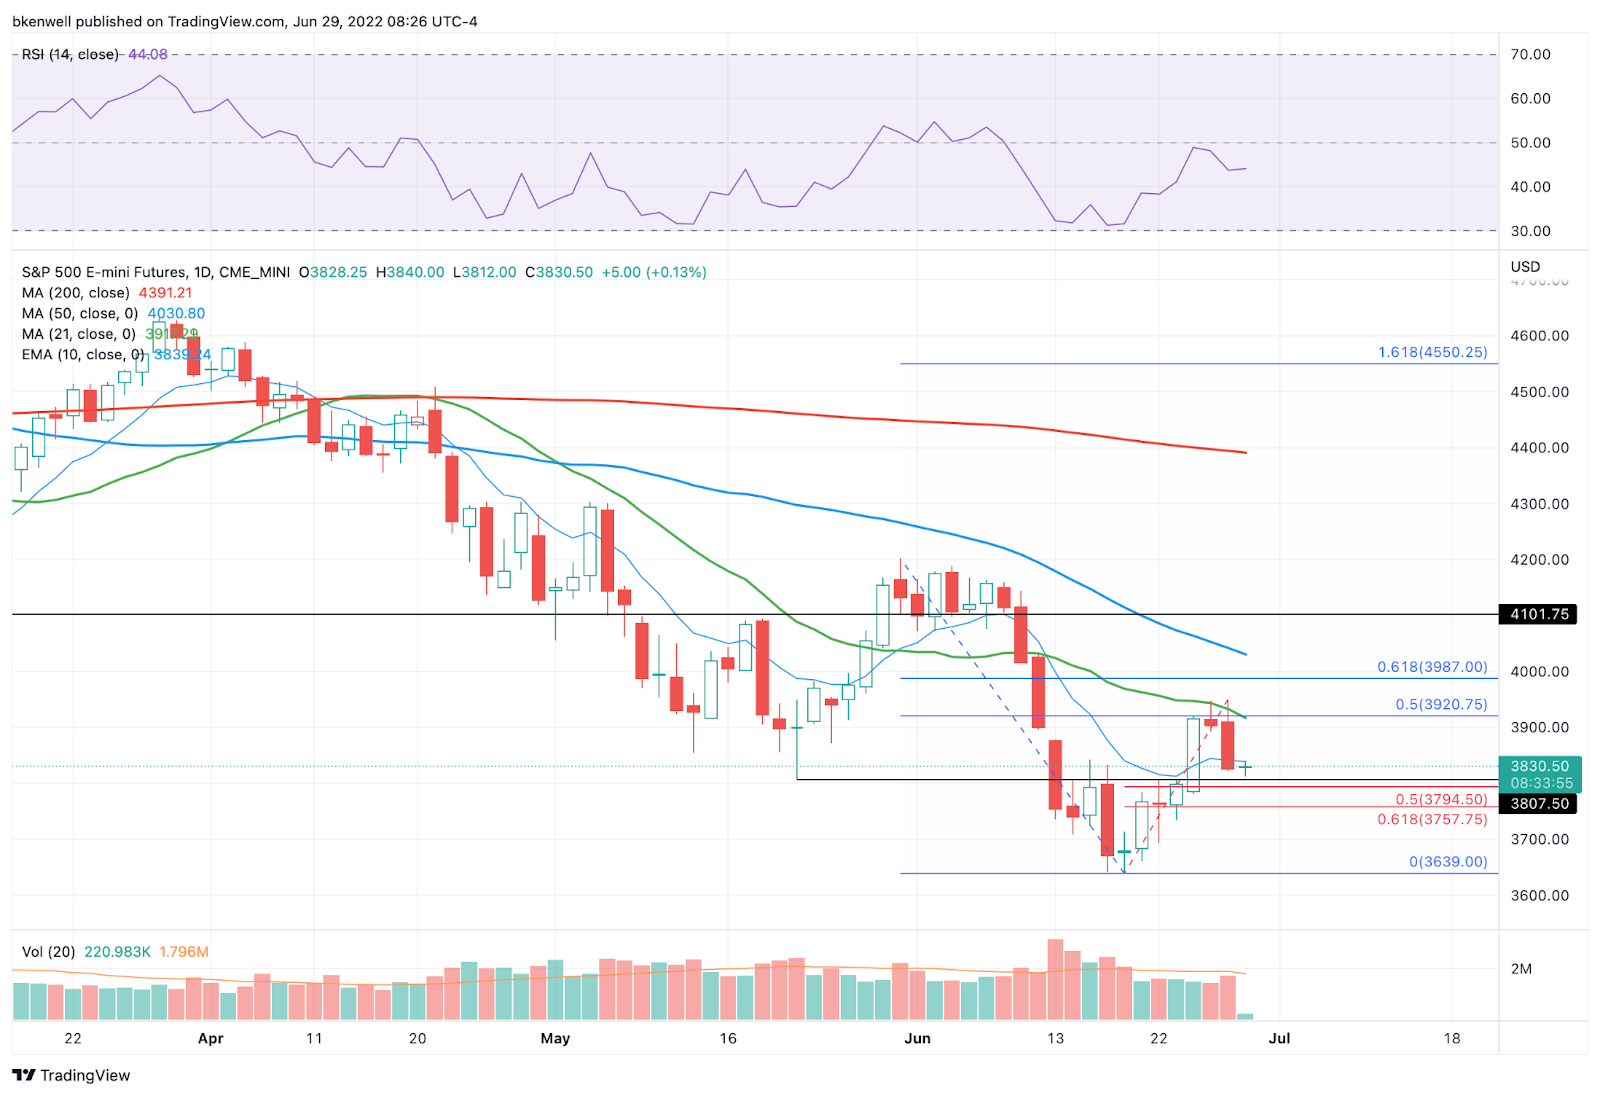
The ES held in a tight range overnight, as it sits just above the 50% retrace of the rally off the low (the red retracements on the chart above) and above the key 3807 level.
From here, bulls need to reclaim yesterday’s low near 3822 and the 10-day.
On the plus side, it’s easy to see if it doesn’t — and if it doesn’t, then that keeps 3807 in play. That’s followed by 3795 and the 3750 to 3760 zone.
Back over the 10-day and we can see a larger rebound.
S&P 500 — SPY

SPY is sort of in a do-or-die spot here near $380. It needs to hold this level in order to remain healthy, although there is a small gap-fill level at $378.83.
Back over the 10-day bodes well for longs, but I think it’s important that traders remain on their toes.
Like we discussed coming into this week, traders need to see the bulls “prove it.” Bulls do not have the benefit of the doubt…the bears do. So operate with that in mind.
Oil — CL

As much as it looked like Oil wanted to break down last week, it reclaimed $106.40 and the uptrend mark. The false breakdown has now sent oil back over $110 as it pushes into a key area.
Let’s see how it handles the $115 area and the 21-day moving average. The rebound has boded well for the XLE…
XLE

Circled above is the inside day, which gave us our inside-and-up trigger and a quick move to the first profit zone between $75 and $76.
I am out of ½ the position now, as I’m less trusting of the rallies at the moment. I might be wrong, but I’d rather be wrong with some money in my pocket.
If the XLE can continue higher, the 50-day and 50% retracement could be in play and that is the next trim zone for longs.
UUP

The dollar remains a slow but steady (and profitable) trade so far. Let’s see if we can’t get $28+ going on the UUP, opening up the $28.20 area.
On the downside, we will continue to ride our ¼ position against a break-even stop-loss at $27.20.
Go-To Watchlist — Individual Stocks
*Feel free to build your own trades off these relative strength leaders*
- Numbered are the ones I’m watching most closely.
- Bold are the trades with recent updates.
- Italics show means the trade is closed.
- DXY / UUP — Still carrying ¼ of the original trade (cost basis: $27.20). On the upside, I’m still looking for $28.20+ to trim more.
- $28.50 to $28.65 is the next meaningful upside target.
- On the downside, we will operate against a B/E stop-loss
- MCK — We have hit two trim zones so far on MCK. Feel free to cash the last ⅓ of the position as you see fit. $335 to $340 is a potential upside target if it continues higher. $310 or even $315 is a reasonable stop.
- XLE — Climbed methodically up to your first trim zone at the 10-day ema → Bulls who do not trust the rallies can be out of ½. (I am out of half for what it’s worth). The next target is the 50-day and 50% retracement against a B/E stop.
Relative strength leaders (List is cleaned up and shorter!) →
- *Look at the strength in health care*
- BMY
- MRK
- ABBV
- UNH
- JNJ
- XLE
- CLR
- VRTX
- DG
- IBM
- MCK
Economic Calendar

As we all know, there’s no crystal ball when it comes to trading stocks, options, or futures. But the Market Imbalance Meter may be as close as it comes. Knowing how the “Big Money” is placing its bets can give our trading room a big wave to ride — or a warning sign to stay out of the water. Come check it out now, risk-free for 30 days.
As we all know, there’s no crystal ball when it comes to trading stocks, options, or futures. But the Market Imbalance Meter may be as close as it comes. Knowing how the “Big Money” is placing its bets can give our trading room a big wave to ride — or a warning sign to stay out of the water. Come check it out now, risk-free for 30 days.
Comments are closed