Our View
Yesterday, Our Lean and the Technical Edge section laid out why we were expecting a rally yesterday. When the bonds acted right, it was like gasoline on the fire and the bulls ran strong with it.
We all know inflation is raging and at the highest since 1981, but a firm bond rally helps drive tech higher. This in turn helps drive the S&P higher, but I don’t think any rally is going to be sustainable.
Today is Opex day and the last trading day of the week. According to Bloomberg, “monthly options expiration [is] estimated at more than $2 trillion.”
“Roughly $495 billion in single-stock derivatives are set to expire Thursday, with another $980 billion of S&P 500-linked contracts and $170 billion in options tied to the State Street fund tracking the S&P 500 all running out as the holiday-shortened week ends, according to estimates from Goldman Sachs Group Inc.’s Rocky Fishman.”
That said, the Dow has been positive in 20 of the last 32 occasions of April Opex, while the Nasdaq has been up in 20 of the past 21 Thursdays ahead of Good Friday.
Our Lean
Volume has already started to slow with the three-day weekend just around the corner. So with this in mind, Our View is for higher prices and buying the pullbacks as long as the bonds are firm. The bonds — ZB — have been key lately.
Yesterday was a damn good day, but we must ask ourselves how far can this rally go? If the ES can hold above last week’s low (4444.50), we are watching 4460 to 4465 on the upside. Above that could put 4485 to 4500 in play. On the downside, watch 4410 to 4415. Below that and 4390 in play, then 4375.
Hopefully, the levels are helpful.
Daily Recap
The ES traded up to 4428.50 on Globex but opened Wednesday’s regular session at 4388.25. That was down 50 points from the Globex high but about 13 points off Tuesday’s low. The ES printed 4487 right after the open, but then it was off to the races.
The ES ripped to 4411 at 9:40, dipped to 4391, and then ran to 4428 at 11:30. From there, each 12 to 13 point dip was bought, all the way up toward 4450. The ES entered the final ten minutes of the session at 4448 as the 3:50 cash imbalance showed $373 million to sell and traded 4442.50 on the 4:00 cash close. The ES settled at 4438.75 on the 5:00 futures close, up 49.25 points or 1.12% on the day.
In the end, it was all about the bonds. In terms of the ES’s overall tone, it was firm all day once the 9:30 open came around. In terms of the day’s overall trade, volume was lower at 1.21 million contracts traded. You can tell the three-day weekend is close.
- Total Range: 65.50 points
- H: 4449.50
- L: 4384
Technical Edge
- NYSE Breadth: 83.4 Upside Volume (!)
- NASDAQ Breadth: 81.4% Upside Volume (!)
Well, how about that for a way to hammer home some gains during a short week? On Thursday we made the case for a brewing short-term bounce and boy did we get one.
It was a combination of seasonality, the Thursday/Friday low (a day ahead of time because of the holiday), the technicals, and the likelihood of lower volume.
It paid off in a big way, as the ES paid out 50+ points and the QQQ ran to our upside targets. Plus, we were able to manage a few individual stocks into key price targets.
It’s hard not to feel good after ripping off a good couple of days in a tough tape. Now, remember, the last thing we want to do is make mental errors ahead of a long weekend.
Game Plan — A Short-Term Bounce Brewing?
I like that the market is not trading higher in the pre-market. Let’s see if the bulls can grab the ball and run with it for one more day, if only just for the morning session. Above 4444.50 in the ES and we’re looking for 4460 to 4465.
Let’s look at the SPY and QQQ.
S&P 500 and QQQ

Like the ES, the SPY is hanging around last week’s low. Let’s see if it can reclaim 443.50. If it can do that, $445.75 is in play (this week’s high and the declining 10-day). Above that could open the door the 21-day and 200-day near $448.
Keep it simple.
On the downside, $441 is the 50-day moving average and the 50% retracement of yesterday’s range. Bulls don’t want to lose that ahead of a long weekend.
QQQ

Technically an inside day yesterday, which gives us potential for an inside-and-up rotation today. However, this $350 to $351.50 area looks stout.
It’s last week’s low and this week’s high, as well as the 50-day, 10-day and 10-week moving averages. If the QQQ can clear this area, then the 21-day could be in play, followed by the $357 to $360 area.
I don’t see it happening today, but I guess you never know.
We want some follow-through to the upside, but caught the bulk of the move yesterday. So we’ll just see how today goes.
$340 is the obvious downside area that the QQQ needs to hold.
WMT

I’ll update this on the Watchlist, but want to illustrate it again here. Walmart was just a beauty of a trade as it timed up with short-term trend support (the 10-day) and the big breakout area near $152.50.
From here, I’d love to trim into $158 to $158.50. Last week’s high is at $158.41. A small trim around this area is warranted. I am long calls and common stock, so I’d love to pare it down a bit.
Ultimately though, the goal is to get to our first trim spot, move to a break-even stop-loss (to remove the stress) and hopefully ride a push to the $165 to $170 area.
VRTX

No trade here just yet, but want to point out how strong of a stock this has been (we’ve been waiting for a pullback seemingly forever). Aggressive bulls can zoom into a smaller timeframe (hourly, H4, etc.) if they want.
Otherwise, wait for the 10-day to see how it responds.
ABBV
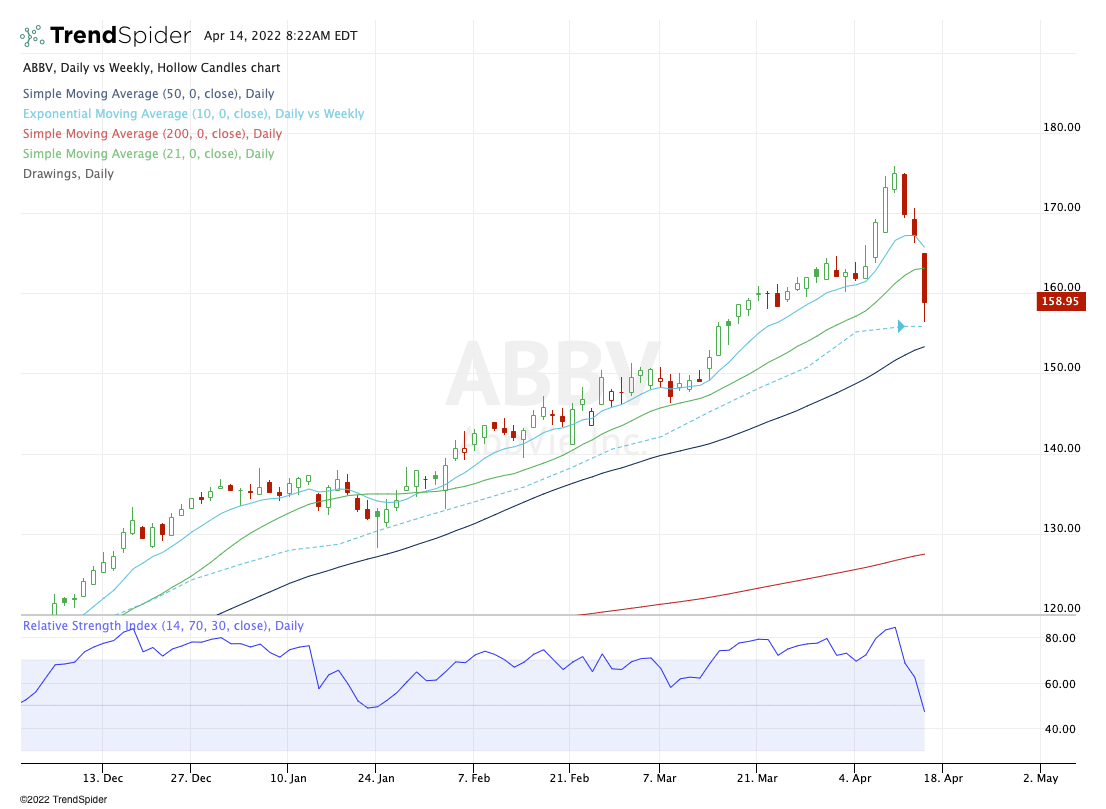
ABBV has been a relative strength monster but has gotten hit.
I would love to see an undercut of yesterday’s low and a tag of the 10-week moving average.
JPM

I’m not personally a buyer of JPM, but several people have messaged me about the chart.
Bullish divergence here (blue arrow), with notable support at $125 via the 50% retracement and the 200-week moving average. A break of that could usher in $113 to $115, then $105.
Go-To Watchlist
*Feel free to build your own trades off these relative strength leaders*
Numbered are the ones I’m watching most closely. Please look at these closely, as there are several updates (the most recent of which are noted in bold).
- PANW — Hit weekly-up level, enough for a trim spot if so inclined. Otherwise, still looking for $645 to $655 on the upside against a B/E stop (near $598)
- MKC — $103 to $104 Trim Spot hit → Stop now at break-even or ~$99. Look for another small trim at $105+ | If we see $107 I want to be down to just ⅓ position
- Taking kind of long to develop. If we don’t get a 2x daily-up over $102.55 tomorrow, I’m inclined to exit even though we have a B/E stop.
- TGT — Monthly-up trigger from Friday hit, as well as our first price target of $236 — Now let’s see if it can settle in. As long as it holds $229.25, let’s see if we can clear $236. Above puts $250 in play.
- HD — Nice pop so far, but a bumpy start to the week on tap. Conservative bulls can use a B/E stop now. I am still looking for $320 to $325 on the upside.
- WMT — Trim spot No. 1 hit, if more conservative with the trade → Either way, a B/E Stop is appropriate now as we look at a potential $158 to $158.50 trim.
- WM — First trim spot $164 was hit. Stopped at B/E
- ABBV — Continues to struggle — Want to see how it reacts to the 10-week.
- ABC — $164 trim spot hit → B/E stop ($160). $166 is the next ideal trim spot. $170 to $172 would be for final tranche.
Look at how strong these stocks have been!! In a market rife with volatility, head-fakes and downtrends, these names are trending higher. That’s why I always say “feel free to build your own trades off these relative strength leaders!” They are dominant.
- COST
- DLTR
- MCK
- BRK.B
- XLB — ADM, MOS, NTR, CTVA, NEM
- ABBV
- TU
- VRTX
- BMY
- Energy — FLNG, XLE, APA, CNQ, CVX, ENB, PXD — etc.
- PANW
- AR
- AMGN
- ABC
- UNH
- VRTX
Economic Calendar

As we all know, there’s no crystal ball when it comes to trading stocks, options, or futures. But the Market Imbalance Meter may be as close as it comes. Knowing how the “Big Money” is placing its bets can give our trading room a big wave to ride — or a warning sign to stay out of the water. Come check it out now, risk-free for 30 days.
Comments are closed