Our View
We’re going to skip the recap today as there’s loads of good information in today’s Opening Print.
We all know that higher interest rates are a big negative for the stock market as the Fed prepares for its taper and interest rate hikes in 2022. If you were trading ~10 years ago, then you should remember the term ‘taper tantrum.’ This term described the 2013 surge in the U.S. Treasury yields, resulting from the Fed’s announcement of tapering its quantitative easing policy and raising interest rates.
Like back then, traders sold stocks thinking that higher rates would cause massive selling (which never happened). I’m not sure the current selloff will end as it did back then when the S&P 500 was up about 150% from the March 2009 low. Now it’s up 600%.
That said, I don’t want to get overly bearish.
My prediction for 2022 was that S&P will see a +15% correction, but I don’t think this is the beginning.
It should be noted that the S&P continued to recover after the tapering program began. Since 2015, the Fed has found a variety of ways to infuse cash into the economy without lowering the value of the dollar. The big question is, can the Fed do it again? Does it have the same tools? The answer…we shall find out in the coming months.
According to the Stock Trader’s Almanac:
Having failed to recover Wednesday’s losses by today’s close, the S&P 500 is now down 1.9% year-to-date and thus our First Five Day (FFD) early warning system is negative. This is the first down FFD since 2016 when the period slid 6.0%. However, the S&P 500 finished that year with a 9.5% gain.
Additionally, the FFD indicator does not have a great track record in midterm election years. In the last 18 midterm election years, only 8 full years followed the direction of the FFD, and of the seven down FFDs in midterm years, just two full years were down — 1962 and 1974.
Earlier this week the Santa Claus Rally (SCR) was positive, but now the FFD is negative. At this juncture, there are two possible outcomes remaining for our January Indicator Trifecta (Santa Claus Rally plus the First Five Days plus January’s Barometer).
Our January Barometer can either be positive or negative. The historical results of both are visible in the following tables. Here’s what it looks like when the SCR is positive and the FFD and JB are negative.

A positive January Barometer would certainly boost prospects for full-year 2022 even after today’s down FFD.
Notable: Following the previous six occurrences when the SCR was positive, the FFD was negative and the January Barometer was positive, the S&P 500 advanced five times over the remaining eleven months and for the full year, with average gains of 9.7% and 11.8% respectively.
In other words, seasonalities tell us that January will be important this year.
Our View
I know the markets look bad, but two things come to mind:
- The ES is at support and short-term oversold, and
- If the S&P 500 doesn’t bounce this week, I think it will going into the January expiration next week.
Here is a link to the Ned Davis S&P and Nasdaq cash study for the January Options expiration, which are bullish.
Our Lean
Let’s face it, every rally has failed this year. Currently, the S&P is in a downtrend, but the main question is how long will it last?
The ES has been down four of the first five sessions of the year and down 140 points from its 4808 high. I know the bond market is weighing heavily on the stock market but I can’t rule out a bounce after this morning’s gap-down open.
The wild card is the Nasdaq. The all-time high is 16,767. This morning it’s trading at a low of 15,363, a drop of more than 1,400 points. So far, it’s lost 1,200 points from this year’s high and has declined in four of the first five trading sessions this year.
On Friday I said the bulls need to be patient and I still feel that way. Exciting? No. But realistic? Yes. A break under 4650 should start a push down to the 4600 level.
As we all know, there’s no crystal ball when it comes to trading stocks, options, or futures. But the Market Imbalance Meter may be as close as it comes. Knowing how the “Big Money” is placing its bets can give our trading room a big wave to ride — or a warning sign to stay out of the water. Come check it out now, risk-free for 30 days.
Technical Breakdown
- NYSE Breadth: 63.5% upside volume
- NASDAQ Breadth: 49.9% upside volume
It’s hard to believe that the S&P 500 and Dow Jones made new all-time highs last week, isn’t it?
Within just a few days (and largely thanks to tech/Nasdaq/growth stocks) we’re trying to figure out where the market will find its footing amid rising rates and a multi-day selloff. We’re near support in some indices, but bonds and interest rates remain a headwind for now.
The market is setting up for a notable gap-down this morning. That to me is better than a gap-up. Amid a pullback, gap-ups are the worst. It allows bears to get a nice high price to short and continue flushing the market lower. It’s hard to bottom on gap-ups.
I have no problem with shorting, by the way. But when you are looking for a bottom, gap-ups are a disservice to bulls. For newer traders, gap-ups have a tendency to suck them in on the long side (FOMO) and then stop them out.
A gap-down is a much better approach, even if it doesn’t lead to a bottom. It at least gives longs a level to pivot against.
Because we have a gap-down and not a gap-up, I am not looking at too many short setups this morning.
Game Plan
On Sunday, Danny and I were talking about the markets. What do you think? Where do we go from here?
I told him that the S&P was sitting on its 50-day and that we had a mild bounce off Friday’s low. At the very least that gives us a low to keep an eye on (it’s also last week’s low, adding to its significance).
I told him that if we break this low and can’t reclaim it, then more downside could be in store. Conversely, holding or reclaiming this low could set up the bulls for a bounce.
We’ll find out this morning how that low is going to be handled.
S&P 500
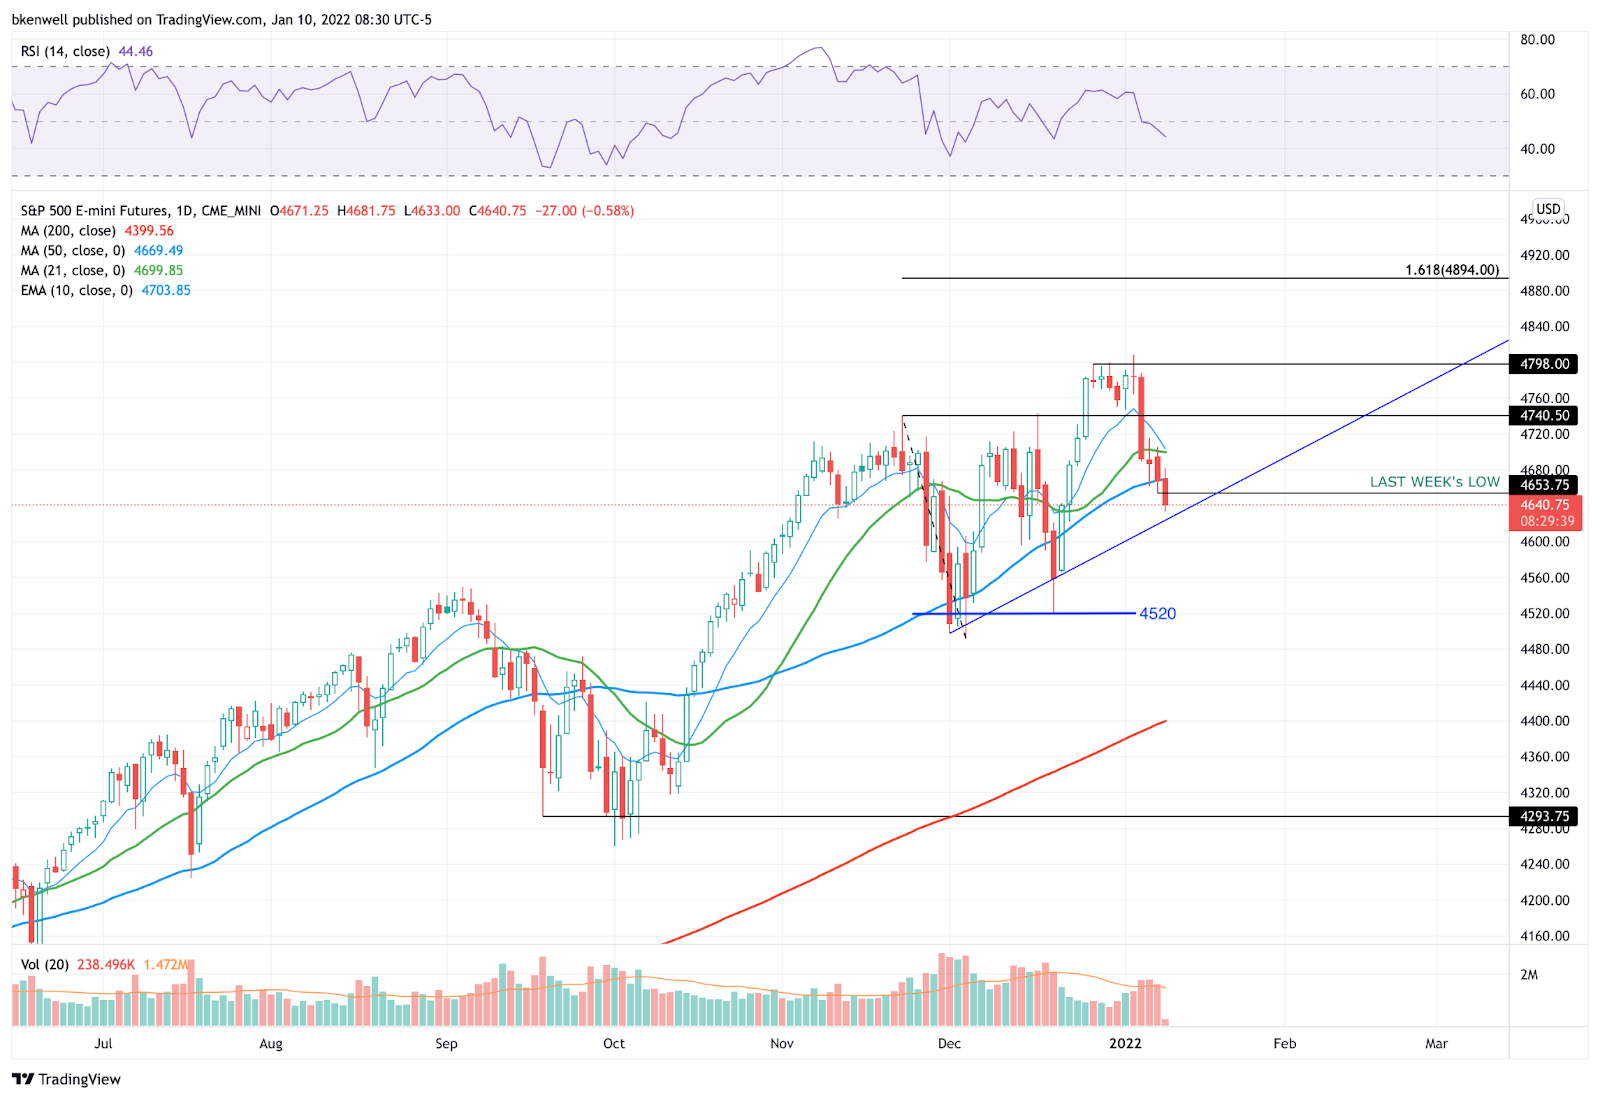
Depending on what instrument you trade, last week’s and Friday’s low will be different.
- Last week’s low in the ES is ~4654
- In the SPY it’s $464.65
- In the S&P 500, it’s ~4663
For now, that is the level to watch. Above is a daily chart of the ES, showing what this morning’s action looks like. For the S&P and SPY, it will result in a gap-down open.
What I want to see is, can the S&P reclaim Friday’s low? If it does, can it stay above it?
For some traders (potentially me included) a reclaim of Friday’s low will be an opportunity to get long, with a stop just below today’s low of day. Unfortunately, it depends on how low today’s low is. If it’s too low, the risk/reward simply won’t be worth it.
On a bounce, the 50-day moving average is the next level to clear. Above that and Friday’s high is the target.
On the downside, a sustained move lower could eventually put the 4520 area in play for the ES. For the SPX, that’s 4530 and for the SPY, that’s $450 to $453. That’s your roadmap for today.
Nasdaq

Gapping below it now, let’s see how the QQQ handles the $377 to $379 zone. That has been strong support twice now. A move below it could put the 200-day moving average in play.
That zone differs for the NQ and Nasdaq Composite, but it’s there too.
Dow

Last week I said the Dow was holding up the best and it went on to have a miserable session that day. That said, the Dow futures are down just 22 basis points this morning vs. a 0.60% slide in the S&P and a 1.1% dip in the Nasdaq.
In the short-term — AKA, today — let’s see if bulls can defend the Dow’s low from Friday following a doji candle. A three-day dip to the 10-day moving average with a doji is normally a bread-and-butter setup.
The market’s morning gap-down sort of takes away from the pizzazz though.
Over Friday’s high seems like a longshot at this point, but if we get it, it would be bullish. For now, a dip below Friday’s low and a reclaim could give bulls a reasonable R/R setup given the relative strength in this one.
In the longer-term though, we want to see if the Dow can hold the 21-day and 50-day moving averages.
Individual Stocks — A Go-To List & BABA
Given the gap-down situation this morning, we are putting less emphasis on individual names and instead are focused on navigating the indices. As for our go-to watch list, it includes:
- Energy & Financials
- F — (looking for a pullback to the 10-ema on the 4-hour chart)
- CVS
- ABBV
- TD
- MU — (great trade on Friday off the 10-ema tag)
- COST — dip to the 50-day on Friday & gapping below Friday’s low now. Reclaim of last week’s low could set up a reversal trade. Watch for a red-to-green open.
- DG
- KO (defensive)
- MDLZ (defensive)
- BRK.B
Additional Note: The Alibaba monthly-up rotation from Friday remains intact and the stock is not down in pre-market trading. Let’s see if that remains true after the open.
Disclaimer: Charts and analyses are for discussion and education purposes only. I am not a financial advisor, do not give financial advice, and am not recommending the buying or selling of any security.
Remember: Not all setups will trigger. Not all setups will be profitable. Not all setups should be taken. These are simply the setups that I have put together for years on my own and what I watch as part of my own “game plan” coming into each day. Good luck!
Economic Outlook

Comments are closed