Buying the dip has been working.
Follow @MrTopStep and @BretKenwell on Twitter and please share if you find our work valuable.
Our View
We all know the markets can turn on a dime. Right now the S&P is going up, but for how long? The bulls’ case is that the Fed will only do 25 basis point increases this year and hold, while also avoiding a recession. They also seem to be okay with one round of lower guidance (particularly from tech) as long as it is within the ballpark of consensus estimates.
They also argue that European markets are up, China is re-opening and only 40% of the global markets are still in a bear market. They hope that the S&P is going to make a 2009 style low — that is, a single low price without being retested and came at a time no one thought it would be the low.
That sounds good to me, but I don’t know if it will go down that way. I’m not a doom-and-gloomer, but the Fed has already made it pretty clear it wants to keep rates higher through the entire year, and at this point, a recession seems like the base case scenario for the economy.
I do think it’s totally plausible that the ES doesn’t make new highs this year or new lows. That we get into this big sort of range trade that sweeps back and forth. We’ll likely know a lot more about the S&P’s direction after the FOMC meeting next week (Feb 1).
Our Lean
It’s not clear what type of market we will have in 2023. However, what is clear right now is that the bulls are taking control as the ES cleared 4035, then 4050 and as the SPX cleared 4015.
That gives the bulls control and has traders looking at the upside levels (for the ES) of 4020, 4080, 4120, and finally 4180.
Zooming in today: Even if the markets do go higher today, it won’t happen without a few downside, algo-fueled stop runs. Today is options FRY-day and most of the day will be determined in the final 60 to 90 minutes. It’s one of those sessions where I would be selling the rallies and buying the dips, looking for the one that makes a nice
In the interim, you can sell the rips and buy the dips!
MiM and Daily Recap

The ES traded up to 4063.50 on Globex, opened Thursday’s regular session at 4059, and traded up to 4068.25 in the opening minutes. After the push, the ES sold back off down to 4035.25 at 9:50, then rallied back up to 4060 at 10:20 and they traded it back down to new lows at 4027.25 (and for the daily low at 10:55). That kickstarted a massive rally in the afternoon, where all the 10-12 point dips were bought.
The ES traded 4066.50 as the 3:50 cash imbalance showed more than $400 million to sell, but climbed more than 10 points to a new session high of 4077, before trading ~4075 at the 4:00 cash close. At 5:00, the ES settled at 4067.75, up 43.50 points or 1.1%.
In the end, the ES did rally but there were some decent pullbacks along the way. In terms of the ES’s overall tone, it was firm. In terms of the ES’s overall trade, volume was low at 1.56 million contracts traded.
Technical Edge
- NYSE Breadth: 67% Upside Volume
- Advance/Decline: 69% Advance
- VIX: ~$19
S&P 500 — ES

We cleared 4056, which opened the door to the 78.6% retracement near 4096. That’s still in play if the bulls can take control after the open.
On the downside, we really want to see the ES hold up over Monday’s high of ~4056 (which was this week’s high until yesterday). That’s also around the Globex low currently.
If it can do that, then yesterday’s 4077 high is still in play.
SPY
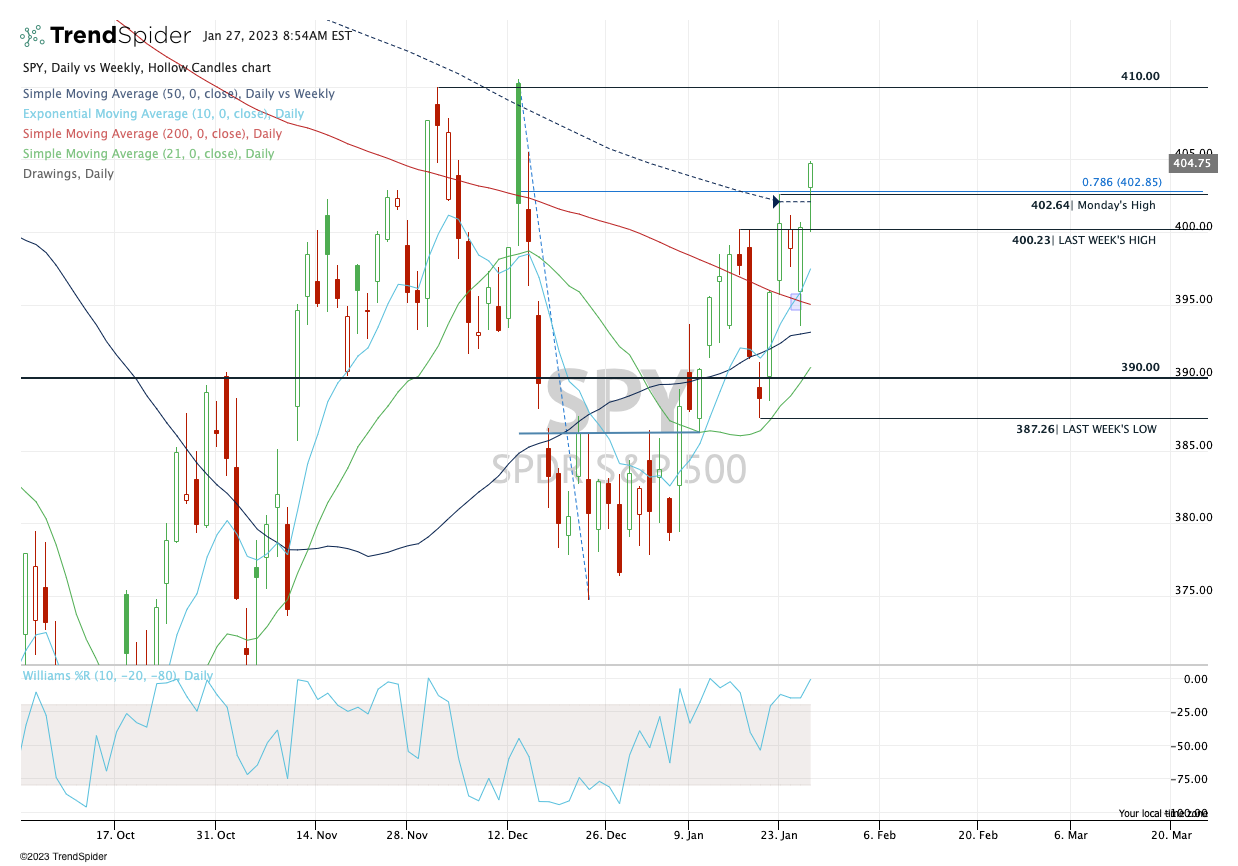
Yesterday played out nicely with the opening fade, followed by a strong rally in the afternoon.
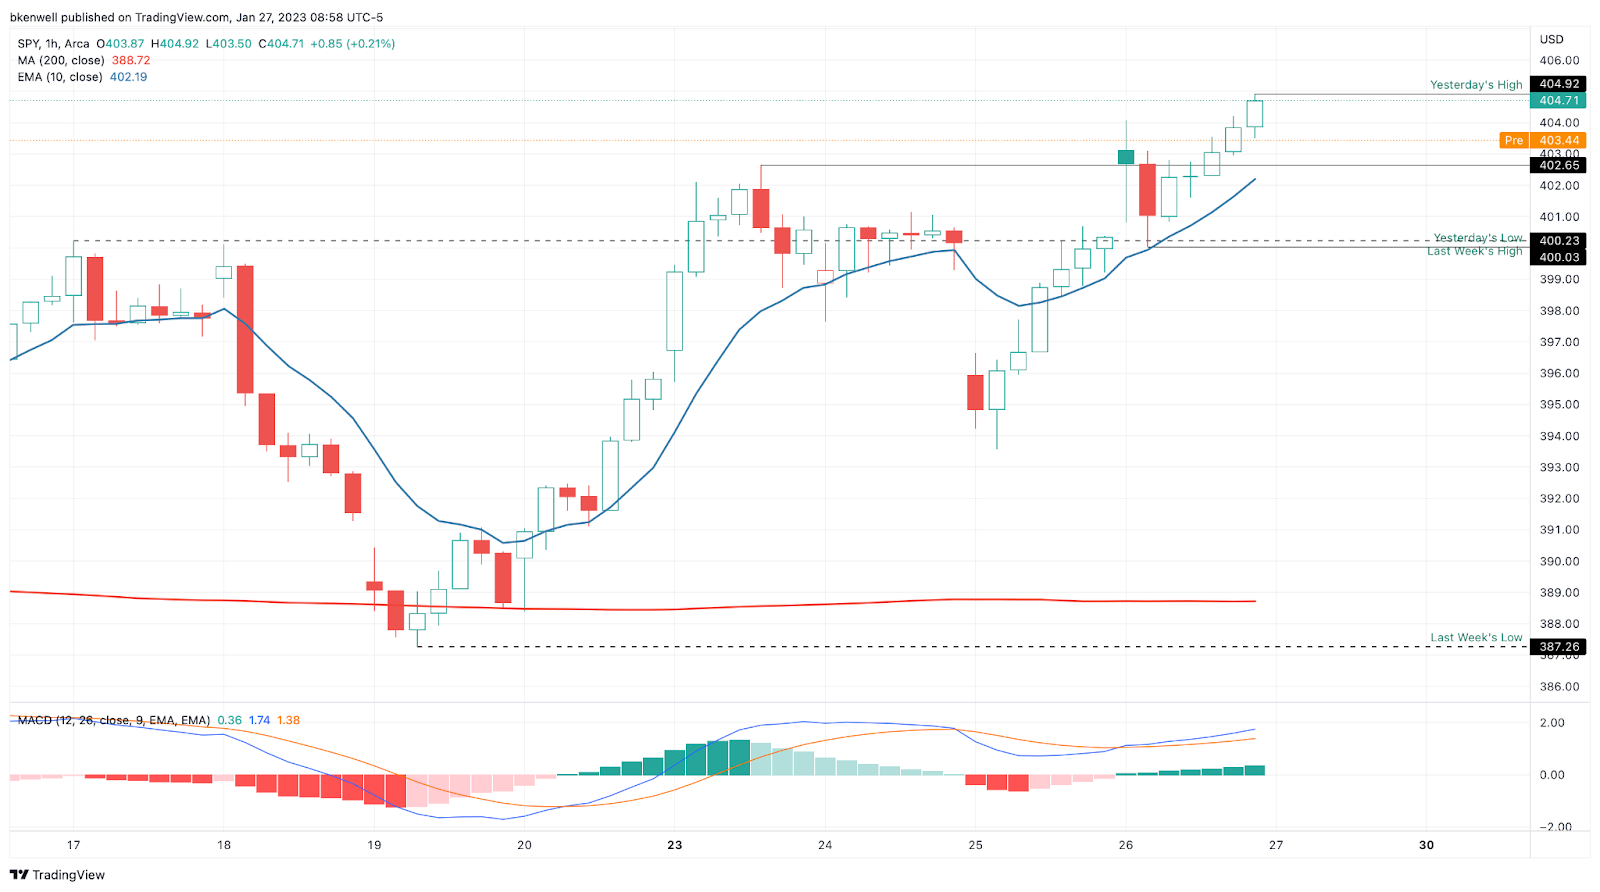
Today, let’s see if the SPY can stay above the 402.65 to 402.85 area. If it can hold this zone, yesterday’s highs near $405 remain in play.
A break of that range could put $400 back on the table, but that is an area that the S&P really needs to hold.
With any luck, the 10-ema on the 1-hour chart will get a quick test and hold as support (same goes for SPX):
AQUA

Pretty simple stuff here. I am looking for a dip down to the $45.50-ish area, one that aligns with prior resistance and the rising 10-day moving average.
Individual Stock Setups — CVX, LVS, WYNN

I have never presented my charts like this, but if the bulls take control of the SPX today, I will be keeping an eye on some of the recently strong stocks.
In this case, I am looking at a few individual names to lead the charge, with CVX, LVS, and WYNN shown above on the 1-hour timeframes.
If we get dips to the 10-ema on the H1 chart, I am looking to be a small buyer or call-option player if these names firm up around this measure.
Note: If the market is weak and can’t hold, then I will not trade these names. But lately, bulls have been in control and if they take control again today, I am looking for these stocks to show some resilience.
Open Positions
A note: After talking to some members, I want to make the setups a bit more clear. We are a trade-ideas service but want to make entries & exits simpler to understand. We will be sending more updates, a few educational pieces and looking for a way to make our setups more clear in how we are managing them.
- Numbered are the trades that are open.
- Bold are the trades with recent updates.
- Italics show means the trade is closed.
— Any positions that get down to ¼ or less (AKA runners) are removed from the list below and left up to you to manage. My only suggestion would be, B/E or better stops.
From this latest round, that includes TLT, DE and FSLR.
- COP — Long from $119, the 2x weekly-up. Trimmed ¼ at the 50-day. Still watching $123.50+ for the next trim. Can technically raise stops to $118-119 or B/E, (whichever suits your style better).
- If still long, $127 to $127.50 is the next trim spot
- MRK — Long from $108.75 — first target: $111 to $112.50. Stop at $106.75 to $107.
- NKE — Down to ⅓ or ½ after yesterday’s $128+ Trim. Looking for $130+ to exit more/all. B/E stop.
Go-To Watchlist
*Feel free to build your own trades off these relative strength leaders*
Relative strength leaders →
- SBUX
- TJX, ULTA, NKE
- CAT
- BA & Airlines — AAL, DAL, UAL
- GE
- WYNN, LVS
- CAH
- AQUA
- MELI
- AEHR
- HCCI
- MRK — weekly
- FSLR
- XLE — XOM, CVX, COP, BP, EOG, PXD — (Weekly Charts)
Economic Calendar

Comments are closed