Our View
We are seeing what happens when too many traders get too far offside on the short side. Combine that with portfolio managers and hedge funds that are underwater this year and you get what we’re seeing now: A vicious bear-market rally.
I don’t know how or when this one will end, but these types of moves can induce incredible pain for those that are short. First they torture the longs with the fast and relentless declines, then they flip over to the shorts and give them a taste of it too.
The larger trend is still to the downside, but that doesn’t mean this upside move doesn’t have any juice left. If we zoom out a bit, the 50% retracement of the 2022 range is at 4223 on the ES. That’s about 60 handles away and could be an area of interest for the longs.
Our Lean
There’s a good chance the ES pops again today, so I’m looking to buy the pullback on Globex or buy the down open/early weakness.
In yesterday’s Technical Edge section below, we noted the buy-stops that were building above 4140 to 4150 and yesterday’s burst through this area highlighted just that. If the ES can build above yesterday’s high (4170), it could put 4200 in play, then the aforementioned 4223 level. Above that puts 4300 in play, but I think that will be a brick wall.
More than anything, I want to be bullish and say the bottom is in. But we are up more than 14% from the low and I don’t think the bottom is in. For now, we keep riding the trend (which is on the long side) but we must keep perspective of the larger trend (which is still bearish).
Our Lean: I would love a retest of the 4140s for a dip-buying opportunity early in Thursday’s session.
Daily Recap
The ES traded down to 4084.50 and rallied up to 4122 at 8:57 am and opened Wednesday’s regular session at 4115.75. The ES traded down to 4112.50, then rallied up to 4129.75 at 9:39, pulled back down to 4115.25 at 9:47, and then rallied ~22 points up to 4137.25 at 10:12. After the high, the ES dropped back down to a higher low at 4114.50 at 10:36 and then surged up to the 4159.75 level.
From there, it pulled back down to 4152.75 at 1:22, back-and-filled for the next hour, and traded a new high at 4166.75 at 3:08. After a small pullback down to 4158.75 at 3:20 as the early MIM showed $348 million to sell and then traded up to another new high at 4170 at 3:45. The ES down ticked and traded 4165 as the 3:50 cash imbalance showed $2.48 billion to buy and dropped ~10 points down to 4154.25 on the 4:00 cash close. The ES traded up a few points to 4157.25 and then sold off down to 4150.25 at 4:26 and settled at 4152.50 on the 5:00 futures close, up 62.50 points or 1.50% on the day.
In the end, the ES staggered early and then the bulls took over. In terms of the ES’s overall tone, the market remains resilient. In terms of the ES’s overall trade, volume was low for the size of the rally at 1.63 million contracts traded.
- Daily Range: 85.5 points
- H: 4170
- L: 4084.50
Technical Edge
- NYSE Breadth: 66% Upside Volume
- NASDAQ Breadth: 79% Upside Volume
- VIX: ~$22
Game Plan: ES Futures, SPY, NQ Futures, QQQ, CHNG, O
We’ve had a nice move since last week’s low, up over 6%. However, we have really lacked the upside breadth that shows a true return of demand.
As noted above, this does not mean the S&P can’t go higher. However, it is something we’ve taken note of if and when the market switches gears.
A Trade on the S&P (ES and SPY)
The first chart is a look at the ES futures and the second chart is the SPY, depending on which one you prefer to trade. Instead of the usual “bigger picture” look, let’s look at a shorter-term setup today.
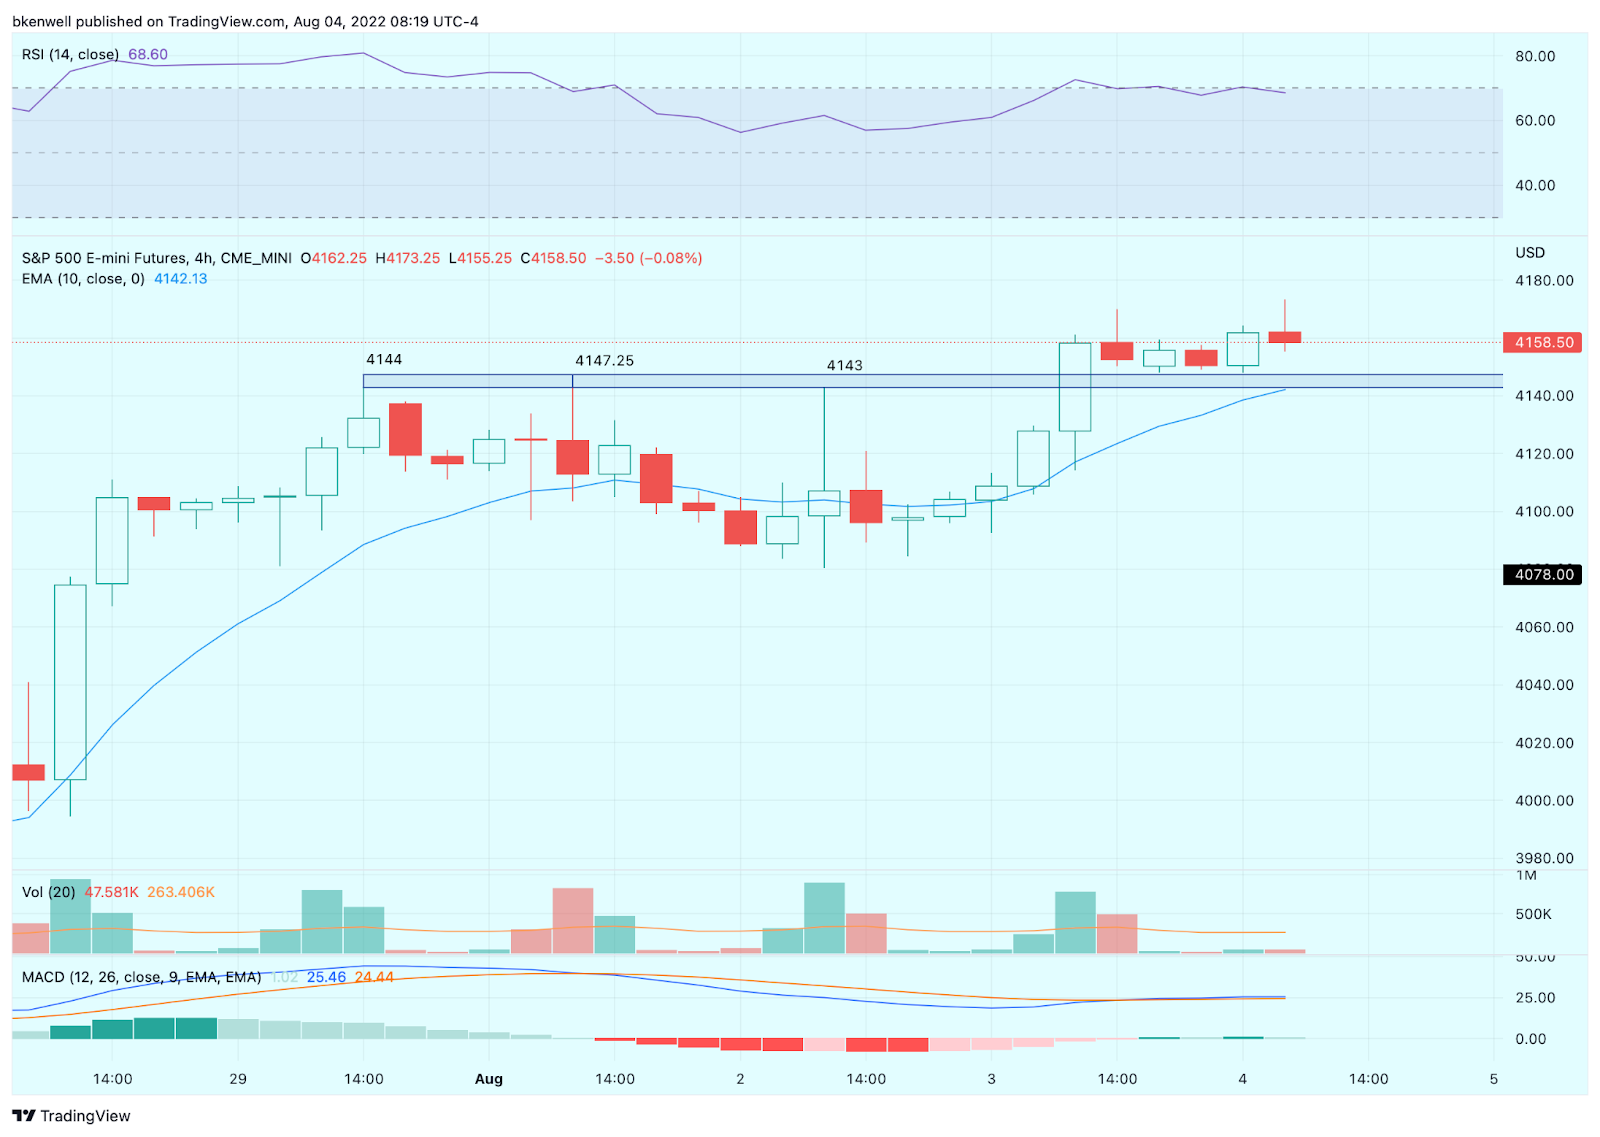
Above: Prior to Wednesday’s rally, the ES topped out at 4144, 4147.25 and 4143 on Friday, Monday and Tuesday. If we get a dip back into the mid-4140s and a tag of the 10-ema on the 4-hour chart (which is shown above) I want to be a buyer.
When prior resistance becomes new support, that’s bullish.
If it fails, then we know right away. We don’t have to lose 20 or 30 points to find out. That’s the beauty of these “lines in the sand” trades. Either it holds and we bounce or it fails and we’re out.
Below: For the SPY, the level to watch is ~$413. The high from Friday, Monday and Tuesday were $413.03, $413.36 and $413.00. The 10-ema on the 1-hour chart (shown below) also comes into play in this area.
A dip to this area that holds should give us a bounce. If it fails, we know right away and can cut our losses quickly.

Nasdaq — NQ

A notable break above the 13,000 and 13,150 areas. Now pushing higher, bulls want to see this zone become support on the dip. If we do dip between now and the end of the week, see if support comes into play from the 10-day and 21-week moving averages (near 12,950).
On the upside, we can’t take 13,500 to 13,650 off the table unless support fails.
Nasdaq — QQQ

Beautiful action for the QQQ bulls. Bigger picture, we can’t take $330 to $333 off the table, which is the 61.8% retrace of the Q2 range.
On the downside, $310 to $313 is vital support in the short term. Ideally, $318 to $320 will act as support for the longs.
CHNG

Those who missed the prior entry can look for an inside-and-up rotation on CHNG over $24.25 today.
O

O is also from our list of individual stock trades from earlier in the week.
The dip to the 10-day is wavering at the moment, but if we get a dip into the $70.50 to $71 zone, take notice. That is the minor breakout zone and the 21-day moving average. Holding this level on a dip could give us a nice bounce, IMO.
Go-To Watchlist — Individual Stocks
*Feel free to build your own trades off these relative strength leaders*
- Numbered are the ones I’m watching most closely.
- Bold are the trades with recent updates.
- Italics show means the trade is closed.
Trade Sheets: Now have 2-3 live trades, all with breakeven or better stop-losses. Great stress-free position to be in as we try to squeeze a bit more of upside out of this move.
- MCK — We have hit two trim zones so far on MCK. Feel free to cash the last ⅓ of the position as you see fit.
- Moving stop-loss up to $325 and given the consolidation, I am thinking of holding my last ⅓ for a push to $348 to $350.
- PEP — We got out Target No. 2 at $177. Either all out now or down to ⅓ of a position if playing for a breakout. Stop at $172 (above B/E).
- UUP — $28.60 to $28.80 is ideal first trim zone, but bulls can trim ¼ at $28.50-ish if they’d like, as the UUP runs into the 10-day ema.
- CHNG — volatile session on Monday, but held where it needed to. In fact, that spike down gave us a level to measure against. I’m using a stop-loss in the $23.20 to $23.35 area.
- Looking for $24.50 to $24.70 for first small trim, (i.e. ¼ to ⅕ position trim). More aggressive traders can look for $25+ for first trim
Relative strength leaders (List is cleaned up and shorter!) →
- O
- CNC
- HRB
- ENPH — kickstarted the rally in Solar
- TAN
- FSLR
- MSTR
- LNG
- PWR
- CHNG
- COST — trade is live
- PEP — trade is live
- BA
- UNH
- XLE
- MCK — trade is live

As we all know, there’s no crystal ball when it comes to trading stocks, options, or futures. But the Market Imbalance Meter may be as close as it comes. Knowing how the “Big Money” is placing its bets can give our trading room a big wave to ride — or a warning sign to stay out of the water. Come check it out now, risk-free for 30 days.
Comments are closed