After an “ok” Friday, buyers have to take the next step.
Follow @MrTopStep and @BretKenwell on Twitter and please share if you find our work valuable.
Our View
When I heard about this, I said there is no way the US can do this. However, a report from Reuters confirmed it: The US posted a $39 billion deficit in January because it bailed out a pension fund — and that’s after a $119 billion monthly surplus a year earlier.
I’m not an economist, but I don’t think you have to be to look at these astonishingly off-the-wall numbers. What I do know is the US Federal Reserve is bleeding money. And while the S&P may be holding up, the overall tone of the markets is — at the very least — skittish. This week we will get a look at the January CPI, which has become the most important data point each month.
We’ll also get a boatload of economic reports, Some Fed speak and the February options expiration (Opex). I really don’t know how to tell the pension fund story other than to say… LOOK OUT BELOW!
Our Lean
Personally, I think the ES and NQ closed OK on Friday, but what does that mean? Well, to a long-time floor trader like me, it means the range is still intact.
In other words: If the ES were to gap 20 to 30 points higher, I’d have to sell the open and if it were to gap down, I’d have to buy the open.
According to the Stock Trader’s Almanac, Friday’s February options expiration day has the Nasdaq up 7 of the last 13, while the day before Presidents’ Day weekend (which is the Friday, Opex day) has the S&P up 10 of the last 12 occasions.
As for today — and aside from the gaps trade above — I want to buy the pullbacks.
MiM and Daily Recap

The ES traded down to 4060.75 on Globex and traded 4077.75 on Friday’s regular session open. After the open, the ES traded up to 4088.50 at 9:36, pulled back down to 4064.50, and rallied up to a new high at 4089.75. From there it put in a higher low at 4069.75 and then rallied up to a 4100.75 double top at 10:23. For the next 18 minutes the ES back-and-filled in a narrow range and then got hit by another large sell program that pushed the ES to another higher low at 4072.25.
At 12:20 a few buy imbalances started to show up, pushing the ES back up to 4086.75, then to a new daily high at 4101.50 at 2:21. After the high, the ES fell 16.50 points down to 4082 at 2:32 before rebounding to 4102.25 at 3:49. The ES traded 4103 as the 3:50 cash imbalance showed $350 million to sell. The ES traded 4100 on the 4:00 cash close and settled at 4099.50 on the 5:00 futures close, up 7.75 points or +0.19% on the day.
In the end, all I can say is despite the weakness, the markets did not act too badly. In terms of the overall tone, there was clearly buying going on. In terms of the ES’s overall trade, volume was steady at 1.7 million contracts traded.
Technical Edge
- NYSE Breadth: 48% Upside Volume
- Advance/Decline: 52% Advance
- VIX: ~$21.25
S&P 500 — ES

We got pretty lucky with Friday’s game plan — “look for a reclaim of Thursday’s low (~4078). A successful reclaim could put 4100 back in play” — as the ES opened right near that buy trigger, then ran to 4100.75.
As for Monday, we have a nice “hammer candle” to work with from Friday, but bulls really need some sort of rotation back above the 10-day ema and Friday’s high (4104).
If we get it, 4135 is in play, followed by 4150.
On the downside, a break of 4085 could put the 21-day sma in play, as well as Friday’s low. A break of that mark puts 4050 in play.
ES — Zoomed In
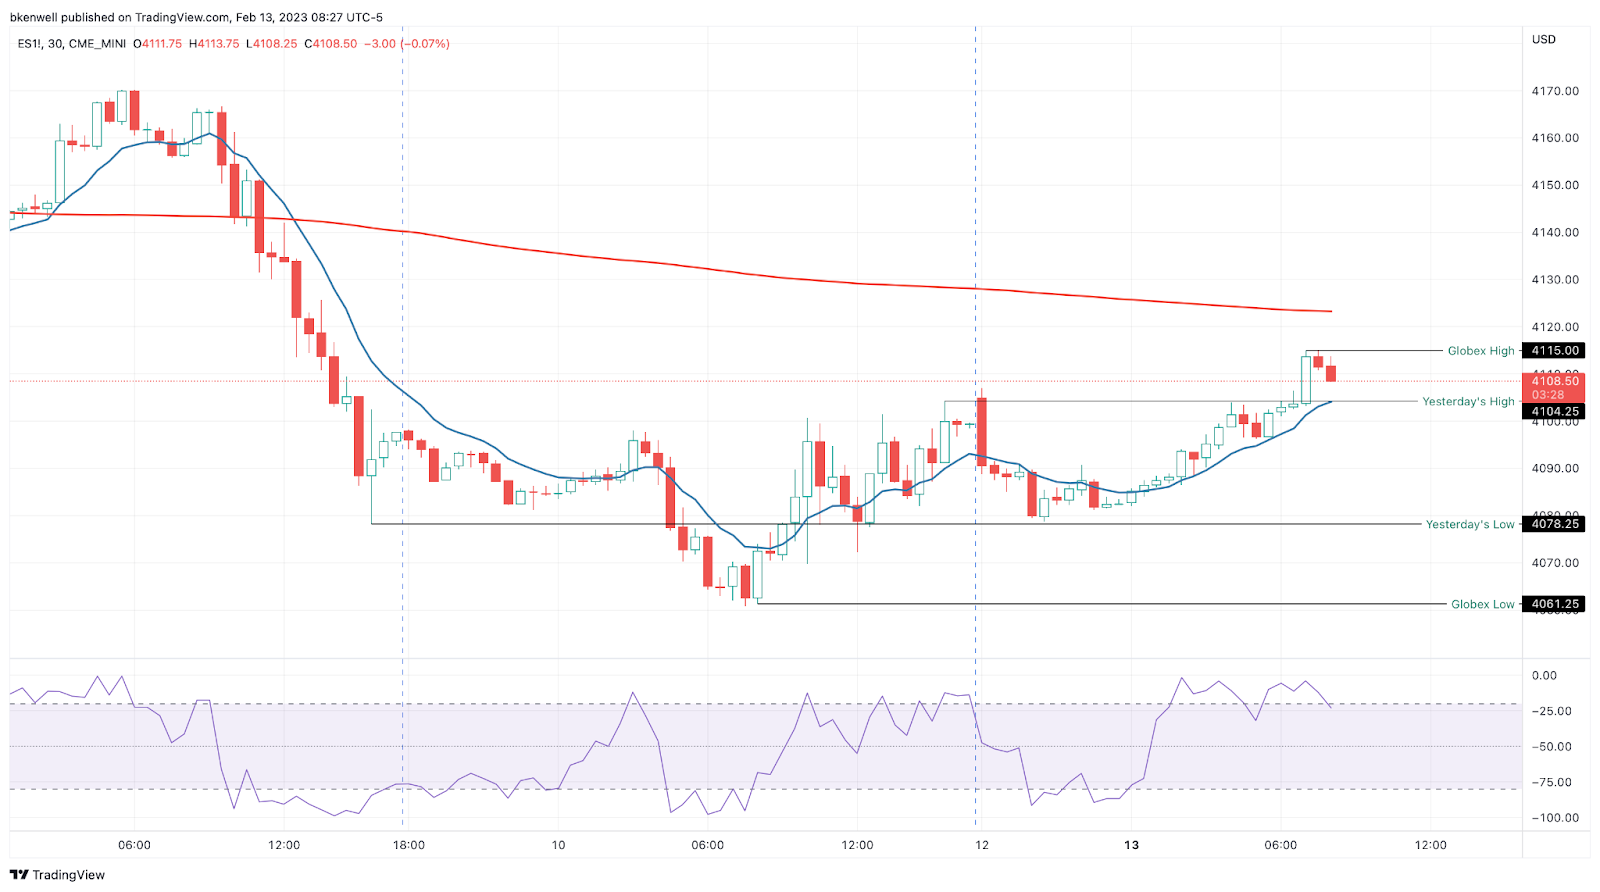
We still have about an hour before the open, but let’s see if 4100 to 4105 can hold as support.
SPY
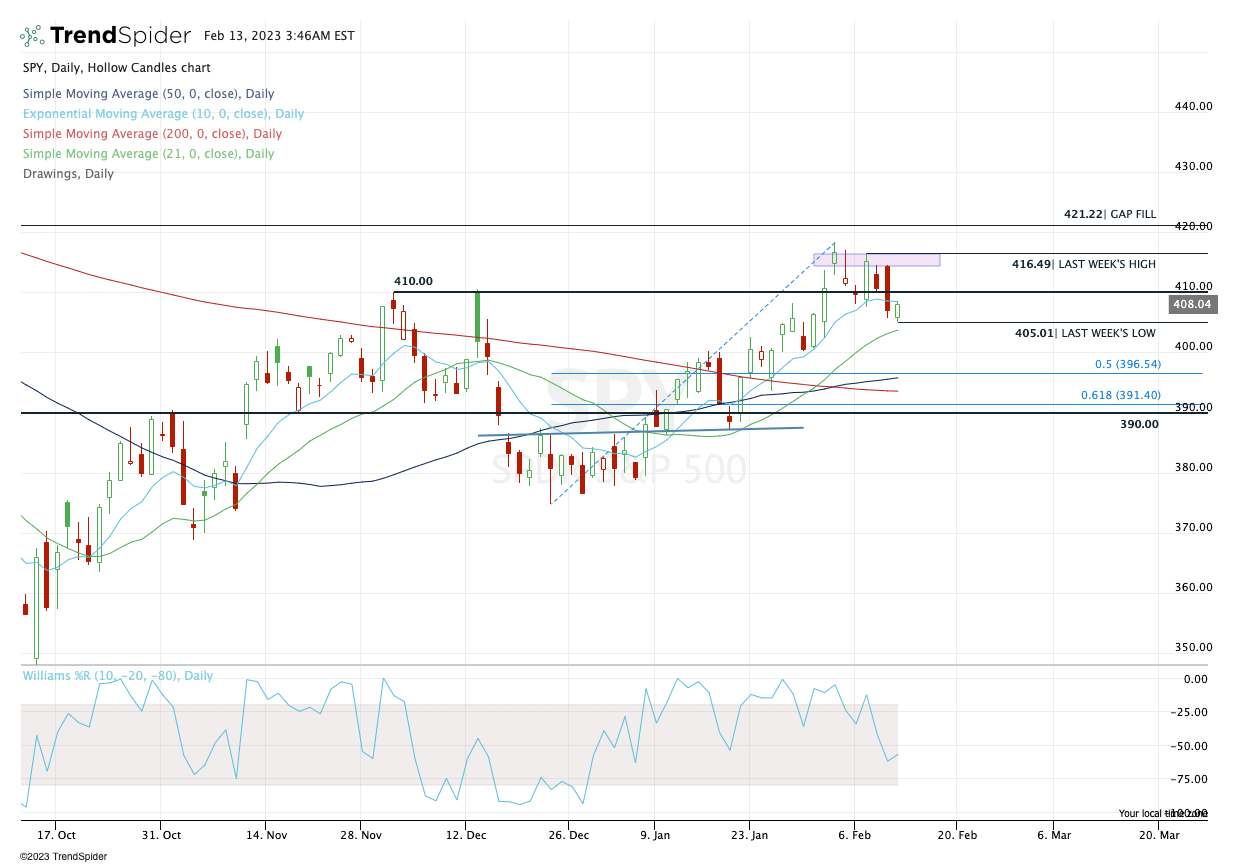
After a couple sessions of weakness, we have an interesting setup in the S&P.
On the one hand, the SPY is below active support via the 10-day ema, as well as the key $410 level.
On the other hand, bulls are still in control, while the SPY is holding the 21-day.
From here, let’s keep a close eye on Friday’s range.
Back above the high (at $408.44) and the SPY can reclaim the 10-day ema and regain $410. If it does that, we are still in a strong tape and the play is to be long equities, with a target back into last week’s high around $416.50.
On the downside, a break of last week’s low near $405 puts the 21-day sma in play. If bulls can’t hold that, I could see a scenario where we dip into the low- to mid-$390s.
AEHR

AEHR fell over 7% on Friday, so while a ~10% dip from Friday’s closing price is rather large, it’s not off the table completely.
If we see the $27 area in the next few days, it looks like a potential buy-the-dip opportunity into a former resistance area and the 50-day moving average.
CAT — Weekly

A pullback into prior resistance near $240 + a tag-and-hold of the 10-week moving average had CAT on my radar.
After an inside doji candle last week, it’s really on my radar. Aggressive buyers are getting long now. I’m waiting for a weekly-up rotation over $252.14.
If we see that, it triggers a weekly-up long, with $258 to $261 being the first target.
Open Positions
- Bold are the trades with recent updates.
- Italics show means the trade is closed.
- Any positions that get down to ¼ or less (AKA runners) are removed from the list below and left up to you to manage. My only suggestion would be B/E or better stops.)
- NVDA — long from $210 — Trim ⅓ at $219+ and down to ½ if we see $223+.
- Stop at $206
- AMD — ½ position — trim ⅓ at $84.50+ (conservative bulls can trim ¼ at $82.75 to $83)
- Stop can be tight at $79 or $80. If in lotto calls, can be full-risk.
Go-To Watchlist
*Feel free to build your own trades off these relative strength leaders*
Relative strength leaders →
- AQUA
- AEHR
- GE
- NVDA, TSLA, SHOP
- SBUX
- MELI
- NFLX
- WYNN, LVS
- AXP
- BA & Airlines — AAL, DAL, UAL
- TJX, ULTA, NKE
- CAT
- HCCI
- XLE — XOM, CVX, COP, BP, EOG, PXD — (Weekly Charts)
Economic Calendar

Comments are closed