The market remains tricky as S&P remains below the 200-day.
Follow @MrTopStep and @BretKenwell on Twitter and please share if you find our work valuable.
Our View
For the last 25 years, I have been an avid believer in the Stock Trader’s Almanac and become close friends with the owner Jeff Hirsch. Last Wednesday night, I got an email from Jeff that he read my overly bearish Opening Print — where I called for new lows this year. He wanted to know if we could turn on the audio in the MrTopStep chatroom and talk about my call and what the Stock Trader’s Almanac was showing.
Jeff explained that the ES made a low in October — something I talked about as the bear-killer month — and then the Santa Claus rally was positive this year. So were the first five days of January. Combined with the pre-election year and the stock market tends to do quite well.
When it came time for me to talk this is what I said.
First off, I am always a bull so if the markets go up I am happy, but I don’t believe that the S&P is going to go straight up. As I have always said, I am not here to fight city hall; if the markets are going up I want to go for the ride. However, I said some of the things standing in the way of the upside include: A hawkish Fed, a looming recession, geopolitical tensions (Russia, China, North Korea, etc.), another potential rally in the Dollar, and a debt ceiling issue.
The economic numbers continue to deteriorate, but this is probably what we need to see for the Fed to lay off on the rate hikes. On that note, silver and gold continue to trade pretty well — particularly the yellow metal.
Our Lean — Update on CPI
As negative as some things seem right now, the trend has been the bulls’ friend. Based on the close, the S&P should move higher, although there will be pullbacks.
I would be a seller of the early rally and buying the dips today.
As for levels, 3960 to 3970 is a potential support zone. On the upside, 4025 to 4030 is resistance so far. Keep in mind, 4030 is the 61.8% retracement. Above it puts 4045 to 4050 in play.
MiM and Daily Recap

The ES sold off down to 3961.75 on Globex and opened Friday’s regular session at 3968.50. After the open, the ES dropped down to 3965.75 and then rallied up to 3991.75 at 10:00 and for the next 25 minutes it ‘back and filled ‘ above the VWAP and then rallied up to a new high at 4000.75 at 10:30.
The ES drifted off the highs in a 10-handle back-and-fill and then sold off down to just a few ticks above the VWAP at 11:17. The ES hovered just above this measure until 12:03 when it rallied up to a new high at 4002.25, pulled back to the 3993.75 level at 1:22 and then rallied up to 4011.50 at 2:33 and did ‘another’ round of back and fill.
In the end, a low VIX, an oversold S&P, and Friday’s option expiration all negated the early weakness. In terms of the ES’s overall tone, it was firm pretty much all day. In terms of the ESs overall trade, volume was lower at 1.41 million contracts traded.
Technical Edge
- NYSE Breadth: 61% Upside Volume
- Advance/Decline: 61% Advance
- VIX: ~$20
It’s Opex week and tomorrow we have some Fed speakers following the PPI and Retail Sales reports at 8:30 a.m. ET.
As for the markets, they are quietly getting stronger as the S&P now sits just below resistance. I guess the question becomes: Do we test into the Q4/December highs or does resistance keep us from doing so?
Further, can the S&P break out over the levels if it gets there?
For what it’s worth, I still like Ulta’s setup from Friday.
S&P 500 — ES

Right now, the ES is running head-first into downtrend resistance and the declining 50-week moving average. If it can clear these measures, it puts the 4100 level in play, then the Q4 and December high.
On the downside, the 10-week ema is on watch, followed by 3920.

If we zoom in on the ES, I am looking at the 3960 to 3970 zone as potential support.
SPY
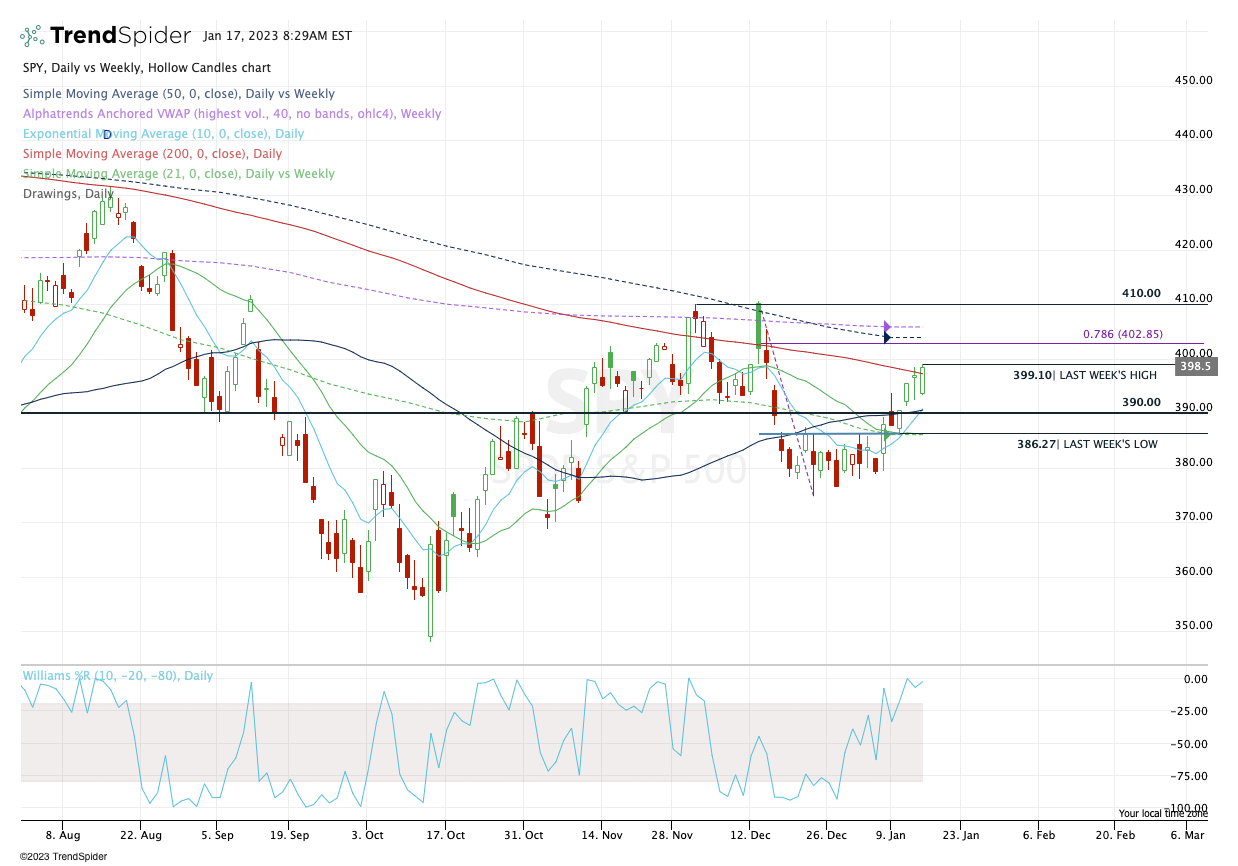
I am always in the camp of Keep It Simple — #KISS. For the SPY, it has filled the gap near $396 and cleared the 61.8% retracement. From here, you’d like to see it hold $397.
Above Friday’s high and we can see a push into the $403 to $405 area. Above that puts the vital $410 area in play.
The trade: Coming into Tuesday under some mild pressure — down 0.2% — let’s see if we can get a daily/weekly-up rotation over $399.10. If so, that could jumpstart the move to $400+
Remember. A rotation needs to hold over the intended level — $399.10 in this case. A “look above” and reverse is the risk. I like to use the 5 and 15 minute charts to gauge it.
QQQ

A nice six-day run here for the Qs, but keep in mind, we will need Big Tech to come for the ride if bulls want to continue the rally.
Let’s see if this can clear $281 to $283. It’s a big zone on the charts, but opens the door to $293 to $295.
TJX

I love this setup, as TJX sits atop prior resistance and at rising uptrend support. $79 is the ideal stop, as it gives room down to $80 and the 21-day.
More conservative traders can consider a stop-loss above $80 if they prefer to hold TJX above last week’s low.
Small trim at $83 if we see it. As for entry, I may just get long near the open. The closer to $81 the better.
CAT

KISS — see if we get a reset down to $250 and the rising 10-day ema.
Open Positions
A note: After talking to some members, I want to make the setups a bit more clear. We are a trade-ideas service, but want to make entries & exits simpler to understand. We will be sending more updates, a few educational pieces and looking for a way to make our setups more clear in how we are managing them.
- Numbered are the trades that are open.
- Bold are the trades with recent updates.
- Italics show means the trade is closed.
— Any positions that get down to ¼ or less (AKA runners) are removed from the list below and left up to you to manage. My only suggestion would be, B/E or better stops.
From this latest round, that includes TLT, DE and FSLR.
- DE — Trimming down to ¼ on any push over $440. B/E stop or consider $425 as a new stop. Congrats! Look for $447 to $450+ on the runners
- COP — Long from $119, the 2x weekly-up. $124 to $127 could be a reasonable trim spot. Trimmed ¼ at the 50-day.
- $116 Stop.
- BRK.B — ½ position — Needs to gain steam back over $320. Stop at $312.
- DAL — Anyone who caught DAL off the open on Friday should be down to ⅓ or ½ — or even completely out — as this is/was a short-term quick trade. B/E or better stop.
Go-To Watchlist
*Feel free to build your own trades off these relative strength leaders*
Relative strength leaders →
- SBUX — nicely weekly-up setup after 10-week ema reset.
- DE
- TJX, ULTA — looking for pullback here to active support (10-day) given the bearish update from LULU.
- CAT
- BA & Airlines — AAL, DAL, UAL
- CAH
- SMCI
- MRK
- BRK.B
- LNG
- LMT, RTX, NOC — RTX best of the bunch
- MET — weekly
- GIS
- HON — weekly
- FSLR — $140 is the 21-week sma and retest of prior resistance
- XLE — XOM, CVX, COP, BP, EOG, PXD — (Weekly Charts)

Comments are closed