They have been struggling with the same resistance all week.
Follow @MrTopStep and @BretKenwell on Twitter and please share if you find our work valuable.
Our View
I have been having a hard time trading the ES and I don’t think I have company, I know it. Are you in that company as well?
If you are, there’s no shame in it. If you’re not, then pat yourself on the back. This has been a tough, choppy tape — and that’s exactly what choppy tapes are designed to do: take money from both sets of traders.
I keep trying to explain that this has become an algorithmic shooting gallery. Like yesterday, the ES puked hard early but then closed just off the highs of the day. The bulls want higher prices and every time the ES sells off, the bears are saying the crash is coming — but what if this is just a 200 or 300-point trading range that keeps whiplashing everyone when they get too long or too short?
Our Lean
From the looks of it, the ES wants higher prices, but bulls need to see the S&P get comfortable holding 4040 to 4050 as support.
This area has been resistance over the last few days. If the ES can clear 4056, it opens the door to the 4090s. On the downside, look for support in the 4030 to 4035 range. (see the ES chart below).
Keep an eye on TSLA today too, as it could be a driver of sentiment (similar to MSFT yesterday).
MiM and Daily Recap

The ES traded a high of 4040.50 on the Globex high, a low of 3985.50, and opened at 3987.50 on Wednesday. From there, the ES traded up to 3994.50 in the opening 15 minutes, then down to 3969.50 at 10:00 ET, before rebounding to a lower high at 3986.50 a few minutes later. The ES traded down to the session low of 3972.25 at 10:40 before the market began to roar higher.
The ES climbed 42.50 handles off the low, tagging yesterday’s low of 4005.25 and pulling back about 12 points at 12:15. From there, the ES rallied another 42 handles to a regular session high of 4035.75 just after 3:00. At 3:50, the ES traded 4025.50 as the MIM revealed $1.2 billion to sell. It traded 4032.50 at the 4:00 cash close and settled at 4029.50 on the 5:00 close, down 0.75 points or 0.02%.
In the end, MSFT opened lower by 3%, fell almost 5% then closed nearly flat. It dragged the markets down and powered them back up. In terms of the ES’s overall tone, with the exception of the early sell programs the ES was extremely firm. In terms of the ES’s overall trade, volume was slightly higher than average at 1.7 million contacts.
Technical Edge
- NYSE Breadth: 62.5% Upside Volume
- Advance/Decline: 54% Advance
- VIX: ~$19.25
I want to do something a little different today. Instead of the typical look at the charts, I want to do a more detailed breakdown of yesterday’s action. Because when you zoom in on the price action, it was honestly fascinating and I am hoping that it can help traders navigate the recent action better.
S&P — SPX

Coming into the day, we were looking at two zones: Either 10-day + 200-day + 50% retrace to hold as support, or the 50-day + 61.8% retrace. In the end, it was the latter — the 50-day and 61.8% retrace — that held as support.
Above is an intraday look at the SPX index on the 15-min chart.
Notice how we came down hard off the open and began to consolidate the opening 60 minutes of action (blue box is the H1 range).
We broke the low but then bounced back (twice) as the S&P wicked off the lows. From there, the SPX powered up through the session high and ran all the way to yesterday’s low.
It was rejected initially, but reset at the rising 10-ema and opening-hour high, then powered to new highs and ran to last week’s high. It reset at the 10-ema again in the final 10 minutes for anyone who wanted to take a lotto shot on a bounce into the close.
There’s nothing groundbreaking here. However, I hope it acts as a reminder to keep an open mind when trading. Conviction is important, but so is flexibility. It helped to sell the rallies early, as the S&P struggled for upside. However, it paid better to turn bullish once the price action told us to.
For me, that was most telling at around 12:30 when the S&P pulled back and held the opening-hour range high + 10-ema. That was a low-risk long opportunity.
S&P 500 — ES

As Danny said, the ES needs to get comfortable above the 4040 to 4050 area — AKA this week’s resistance.
Over Monday’s high of 4056 opens the door to the 78.6% retracement.
On the downside, last week’s high and the recent Globex low came in around 4035. Let’s see if that level (+/- 5 points) can hold up.
SPY

Nice gapper this morning, putting this week’s high and the 78.6% retrace in play near the open, at $402.65 to $402.85.
Let’s see if we can get a little “dance” going on around this level. If we open just above this week’s high (402.65), let’s see if we can get a cash-flow short on a move back below this mark (letting us quickly cash in some chips and work an original stop-loss order just above the session high down to B/E or better).
Otherwise, a sustained move over $402.85 can keep this train moving higher.
Open Positions
A note: After talking to some members, I want to make the setups a bit more clear. We are a trade-ideas service, but want to make entries & exits simpler to understand. We will be sending more updates, a few educational pieces and looking for a way to make our setups more clear in how we are managing them.
- Numbered are the trades that are open.
- Bold are the trades with recent updates.
- Italics show means the trade is closed.
— Any positions that get down to ¼ or less (AKA runners) are removed from the list below and left up to you to manage. My only suggestion would be, B/E or better stops.
From this latest round, that includes TLT, DE and FSLR.
- COP — Long from $119, the 2x weekly-up. Trimmed ¼ at the 50-day. Still watching $123.50+ for the next trim. Can technically raise stops to $118-119 or B/E, (whichever suits your style better).
- Trim $123.50 is you’re still long.
- MRK — Long from $108.75 — first target: $111 to $112.50. Stop at $106.75 to $107.
- NKE — Down to ⅓ or ½ after yesterday’s $128+ Trim. Looking for $130+ to exit more/all. B/E stop.
Go-To Watchlist
*Feel free to build your own trades off these relative strength leaders*
Relative strength leaders →
- SBUX
- TJX, ULTA, NKE
- CAT
- BA & Airlines — AAL, DAL, UAL
- GE
- CAH
- AQUA
- LVS, WYNN
- HCCI
- MRK — weekly
- FSLR
- XLE — XOM, CVX, COP, BP, EOG, PXD — (Weekly Charts)
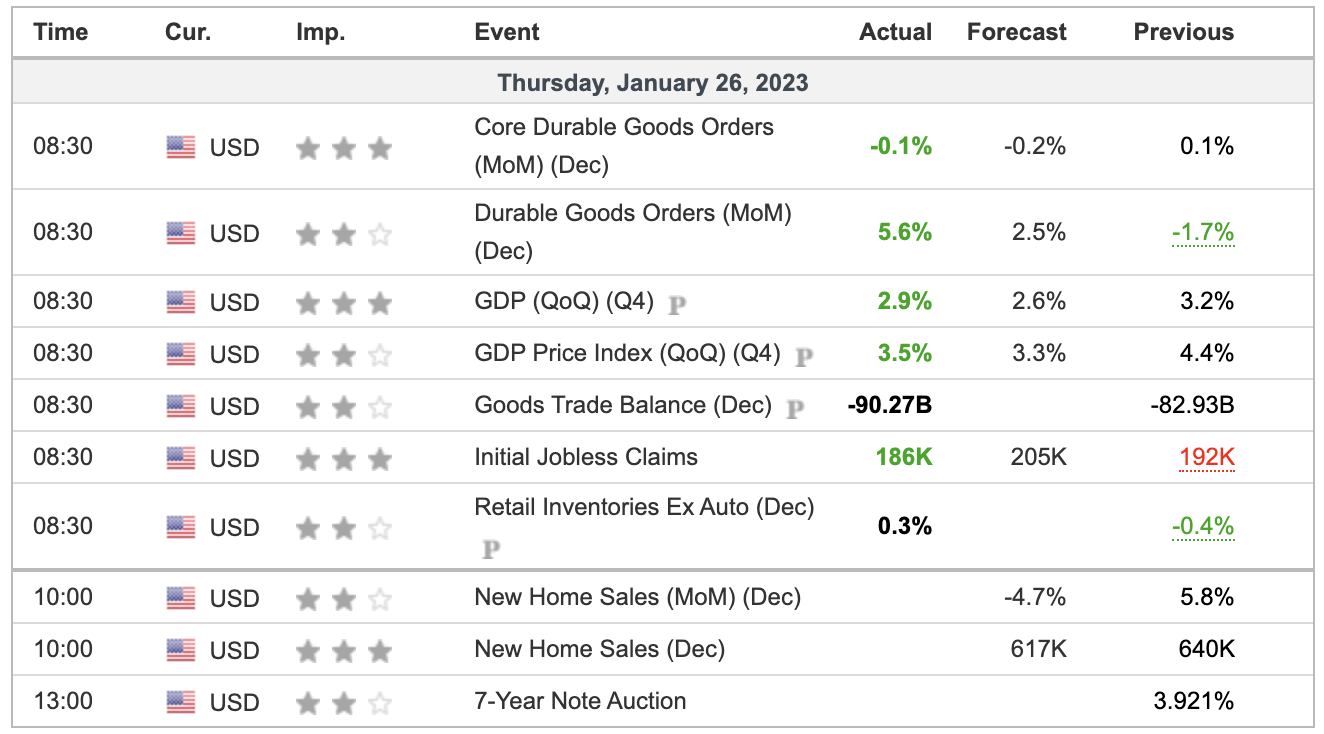
Economic Calendar
Comments are closed