Our View
I would not call yesterday’s pullback a win for the bears.
After a gap up and rip to 4060.50, the ES fell ~58 points down to 4202.75. Despite $2.4 billion to sell on the MIM, the ES rallied. Bonds fell (hard) and crude oil rallied along with beans, wheat, and corn after Lebanon turned away the first shipment of grains from Ukraine.
I played the ES well yesterday and caught the short, but as I said on Twitter… it’s not been an easy trade. Over 4 months ago I started talking and writing about my concerns over the retail traders after the big drop, I was afraid they were getting beat up. I was DMing with one of my favorite followers on Twitter and they said, “retail finance is in a deep depression, well beyond recession.”
I know in times of extreme volatility the bots win and the retail accounts lose. Retail used to make up millions of futures and options accounts, but over the last 20 years, most people that are still trading have moved to stocks and/or stock options. I am not sure how many active futures account there are, but all you have to know is that there were over 150 clearing firms between the Chicago Board of Trade and the Chicago Mercantile Exchange, and today there are less than 5 or 6 that will take a retail account — most of the account have been pushed off to introducing brokers.
When I was on the floor we did a ton of retail business because when the big accounts were not trading, retail was — and don’t think retail means small trades! Some accounts would trade hundreds of lots a day. Today I figure maybe 5% of the daily volume comes from the retail side. That’s a far cry from the 80s and 90s when retail made up a big part of the daily volume.
Our Lean
Based on the current overall price action and yesterday’s late-day uptick, my guess is we trade higher on Globex. If you look at yesterday’s selloff, the ES dropped ~58 points, in line with the 50- to 70-point pullbacks we have been seeing and buying.
Today is FRYday and while I think there will be a two-way trade, I think the bias could see some initial selling and then a bounce. My lean is to sell the early rallies and buy the pullbacks in the first part of the day and see how the ES acts going into the afternoon — i.e. which direction is the prominent trend.
There is no doubt the ES has rallied enough for a larger pullback, but I’m just not sure we are there yet.
Daily Recap
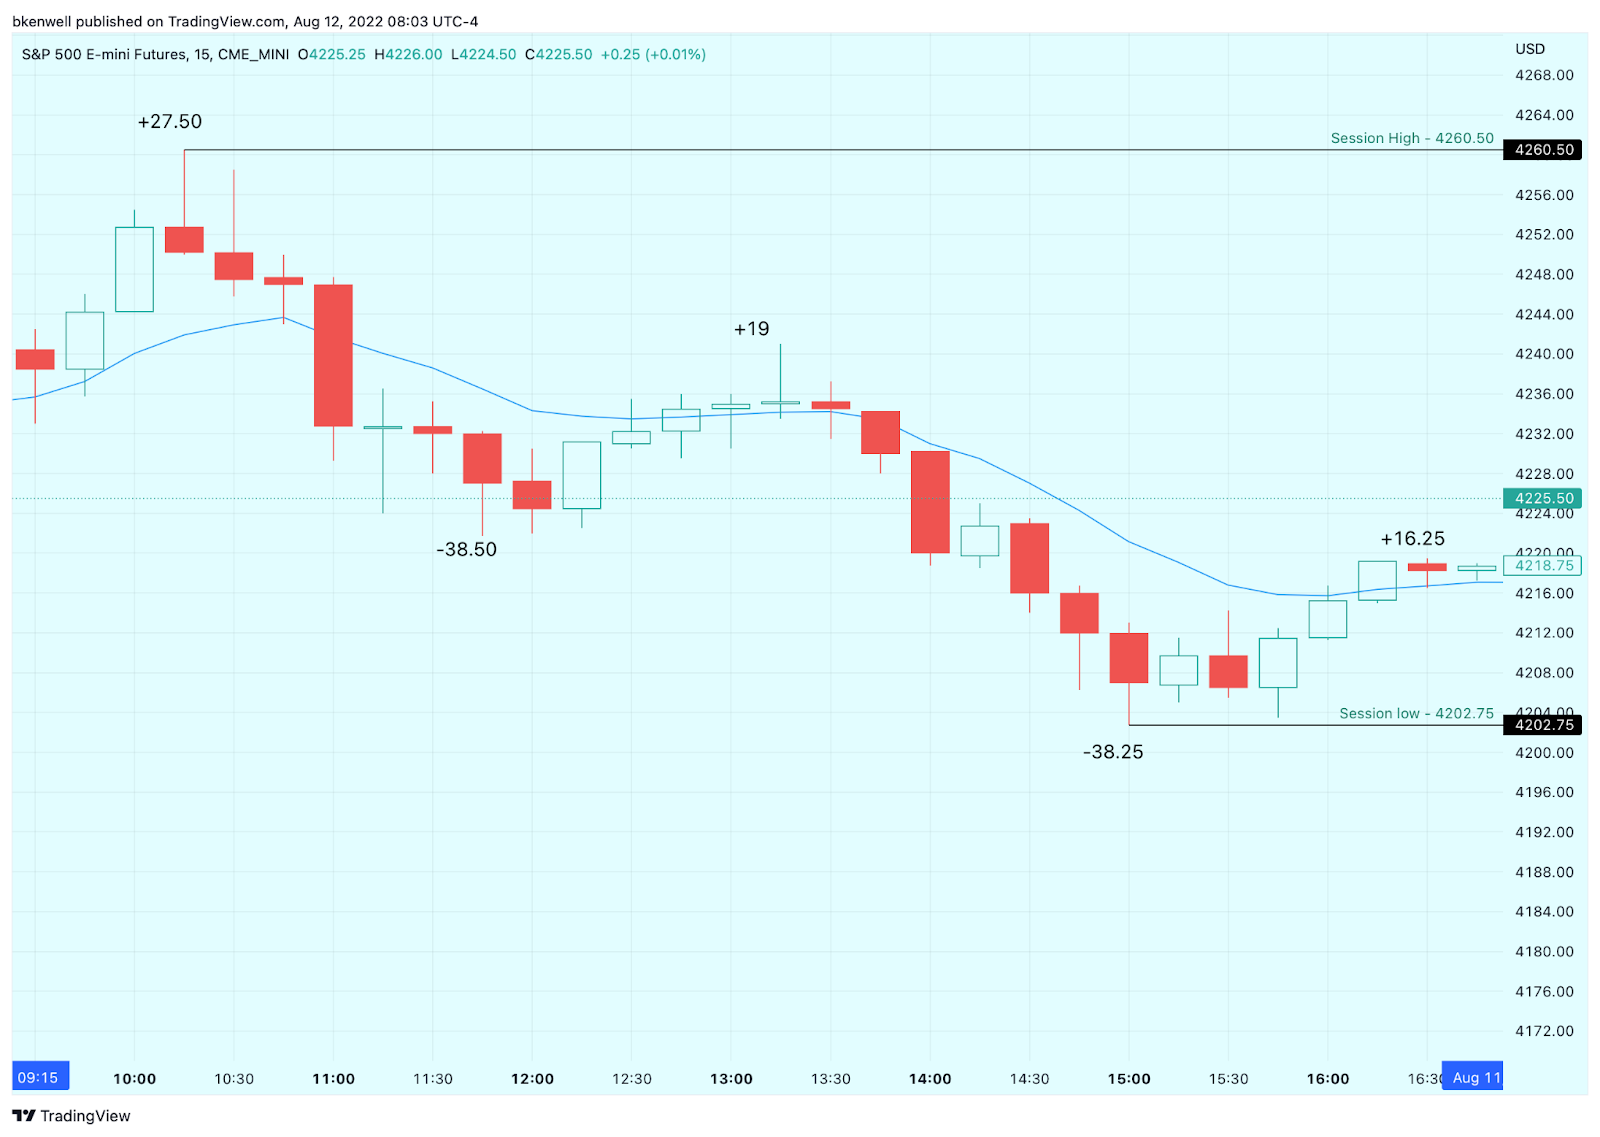
The bulls took control initially, opening at 4240.50, higher by 29.50 points from Wednesday’s 5:00 futures close. After a 7.50 point dip, the ES climbed another 27.50 points to the session high at 4260.50, but then the sellers took hold.
Bonds were whacked and that seemed to creep in the equities market too. A 38.5-point dip was met by a 19-point rally shortly after 1:00, but the sellers stepped again with another 38-point dip before a late-day bounce.
In terms of the ES’s overall tone, it started strong but couldn’t hold up. In terms of the overall trade, volume was normal at 1.55 million contracts.
- Daily Range: 57.75 points
- H: 4260.50
- L: 4202.75
Technical Edge
- NYSE Breadth: 62% Upside Volume
- NASDAQ Breadth: 56% Upside Volume
- VIX: ~$20.10
Game Plan: SPX BMRN, HWM
The Individual stock list went out yesterday and in it, we noted the bonds.
Bonds and stocks do not have a 1:1 correlation, but the weakness we’re seeing in bonds does seem noteworthy at the moment. Let’s get to work. It’s Friday.
Bloomberg wrote a good piece on the bonds yesterday too.
S&P 500 — ES

That’s an ugly candle from yesterday. Daily-down below ~4202 could open a test of the 4170 area, which was former resistance.
If that plays out, bulls will want to see if this level becomes support. Below that opens the door to the 10-day.
S&P 500 — SPY

Daily down for SPY is $419.21.
I’m not necessarily bearish here, but yesterday we noted that we were “cautious bulls.” Part of that caution comes from the potential of something like this…a daily down accelerating some of the selling pressure.
Nasdaq — QQQ

The QQQ was the first to go red yesterday after being rejected from the 10-month moving average.
Watch $323.36 — yesterday’s low. A daily-down rotation could put the post-CPI low in play near $322, then the gap-fill in play near $319 and a test of the 10-day ema.
TLT

We have been yammering on about the bonds, but look at how they rolled over yesterday. See this post from last week for a larger breakdown.
Regardless, the TLT went weekly-down yesterday below $115.89. That’s the level to reclaim today if bulls want to unwind the damage. Otherwise, more selling could ensue.
BMRN

A huge breakout near the $92 to $92.50 area. A dip ot this area and the 10-day for BMRN would be a potential buying opportunity.
HWM

Keep an eye on the $37 to $37.50 area and the 10-day ema. A very strong move for HWM lately and on a dip, I want to see if this area can hold as support.
Initial stop loss near $36.25-ish — just below last week’s low.
Go-To Watchlist — Individual Stocks
*Feel free to build your own trades off these relative strength leaders*
- Numbered are the ones I’m watching most closely.
- Bold are the trades with recent updates.
- Italics show means the trade is closed.
Trade Sheets: Now have 2-3 live trades, all with breakeven or better stop-losses. Great stress-free position to be in as we try to squeeze a bit more of upside out of this move.
- PEP — We got out Target No. 2 at $177. Either all out now or down to ⅓ of a position if playing for a breakout. Stop at $172 (above B/E).
- UUP — $28.60 to $28.80 is ideal trim zone, but bulls can trim ¼ at $28.50-ish if they’d like, as the UUP runs into the 10-day ema.
- $27.95 stop-loss.
- CHNG — Trimmed a little over ⅓ of position into our first target of ~$24.50. Inching stop-loss up to $23.50. Conservative bulls go with a break-even stop.
- Next target: $25 to $25.30
- O — For anyone in it, $74 target hit, B/E stop. $75+ is next area for trim.
Relative strength leaders (List is cleaned up and shorter!) →
- CNC
- HRB
- ENPH — kickstarted the rally in Solar
- TAN
- FSLR
- LNG
- PWR
- CHNG
- COST
- PEP — trade is live
- BA
- UNH
- XLE
- MCK — trade is closed
Economic Calendar

As we all know, there’s no crystal ball when it comes to trading stocks, options, or futures. But the Market Imbalance Meter may be as close as it comes. Knowing how the “Big Money” is placing its bets can give our trading room a big wave to ride — or a warning sign to stay out of the water. Come check it out now, risk-free for 30 days.
Comments are closed