Our View
The ES fell yesterday, but unlike Monday’s weak close the ES rallied on yesterday’s close.
The PitBull won our “battle” yesterday — re (from Tuesday): “The PitBull told me he’s “got a sell signal in the ES and a buy signal on the VIX.” Who’s going to be right?”— but I am not surprised by the weakness at all.
Tech selling has been the flavor the last few days, but the ES is down over the last four days and this morning we have the CPI release. According to FactSet, a survey of economists says the increase in the consumer price index from a year ago probably slowed to 8.7% in July from June’s four-decade high of 9.1%. Even if that’s true, it’s well above the Fed’s target of 2%.
The July number is going to be an important part of the Fed’s next rate-hike decision. According to Goldman Sachs, “the market is still pricing cuts next year, the bottom line is that we still see upside risks to inflation and policy pricing over the next few months.”
Here’s a look at this year’s S&P futures, with each CPI reporting date highlighted on the chart in red.

Our Lean
The futures are trading higher this morning, but I suspect there is going to be a big knee-jerk reaction to this morning’s CPI release. After a big jump in June, expectations are for a tamer number — but I don’t think that’s going to slow things down.
If the ES rallies hard off the number I would be looking to sell the rally and buy the pullback and if the ES dumps early I think the 4112-4115 (Globex low) should be good support, if it breaks there and takes out 4100 to 4096 I think we could see 4075.
On the upside, if the ES gets above 4156 (stops above) I think the ES could see 4177 to 4180
Daily Recap
Tuesday was a choppy session ahead of the CPI report with a downward bias. The ES opened at 4133.50, climbed ~5 points and then fell 20 points down to 4127.75 shortly after 10:10. From there it rallied 14 points to a higher low at 4132.50, dipped 18 points to a new low at 4114.25 at 11:10, then rallied 20 points to 4134.50 at 11:20.
The trade slowed considerably from there, with the ES pulling back and finding support at the 4115 area into the afternoon, about 1 point above the current session low. The ES popped about 11 points from there, trading 4126.75 at 2:00, then traded 4113 at 2:30 — a new session low.
The ES climbed 10 points into the 3:50 cash imbalance, with the MIM showing about $640 million to buy. The ES traded 4125 on the 4:00 close and settled at 4129.25 at 5:00, down 17 points or 0.42%.
In the end, it was more chop ahead of the CPI. In terms of the overall trade, volume was very light at 1.24 million contracts
- Daily Range: 42 points
- H: 4155
- L: 4113
Technical Edge
- NYSE Breadth: 39% Upside Volume
- NASDAQ Breadth: 23% Upside Volume
- VIX: ~$22.25
Today, this week and maybe the rest of this month really boils down to the CPI report. At 8:30 ET, these are the only numbers that will matter:

Inflation should at least back down from June’s results, given the decline in oil and gas prices. Still, a hot reading will not bode well, while the Fed has not really been talking down the idea of higher rates.
As of Aug. 3rd, the market is pricing in:
- A 50 basis point hike in September (no hike in August)
- No hike in October and a 25 basis point hike in November
- A 25 basis point hike in December
- No hike or a cut in February (76% odds of no action or dovish action)
If the CPI reports continue to come in hot, you better believe the Fed is going to become more hawkish.
***In-line or below expectations on today’s report gives the market the opportunity to continue its upside move. Above-consensus results increase the odds we pull back from here.***
Remember, it is the reaction to the report we are looking for, not for the report itself. We are traders, not economists.
Game Plan: ES Futures, SPY, QQQ, NQ Futures
I’ll look at some individual trades after the CPI report is out of the way. For now, just the indices. Also, keep an eye on bonds (TLT and ZB) today.
S&P 500 — ES

Bulls need a sustained move above 4170 to 4175. Bears need a break of 4080. It’s as simple as that.
In June, we had similar action as the 4150 to 4200 area was resistance. The ES was consolidating ahead of the CPI print, then broke lower following the release. I don’t know if the same pattern is setting up, but it’s something to watch.
Dialing in, the 4110 to 4115 area may be of some interest as support. That was yesterday’s low and is the Globex low as of 8:00 am ET. Obviously this level will completely depend on the reaction to the CPI report. But it’s worth knowing.

S&P 500 — SPY
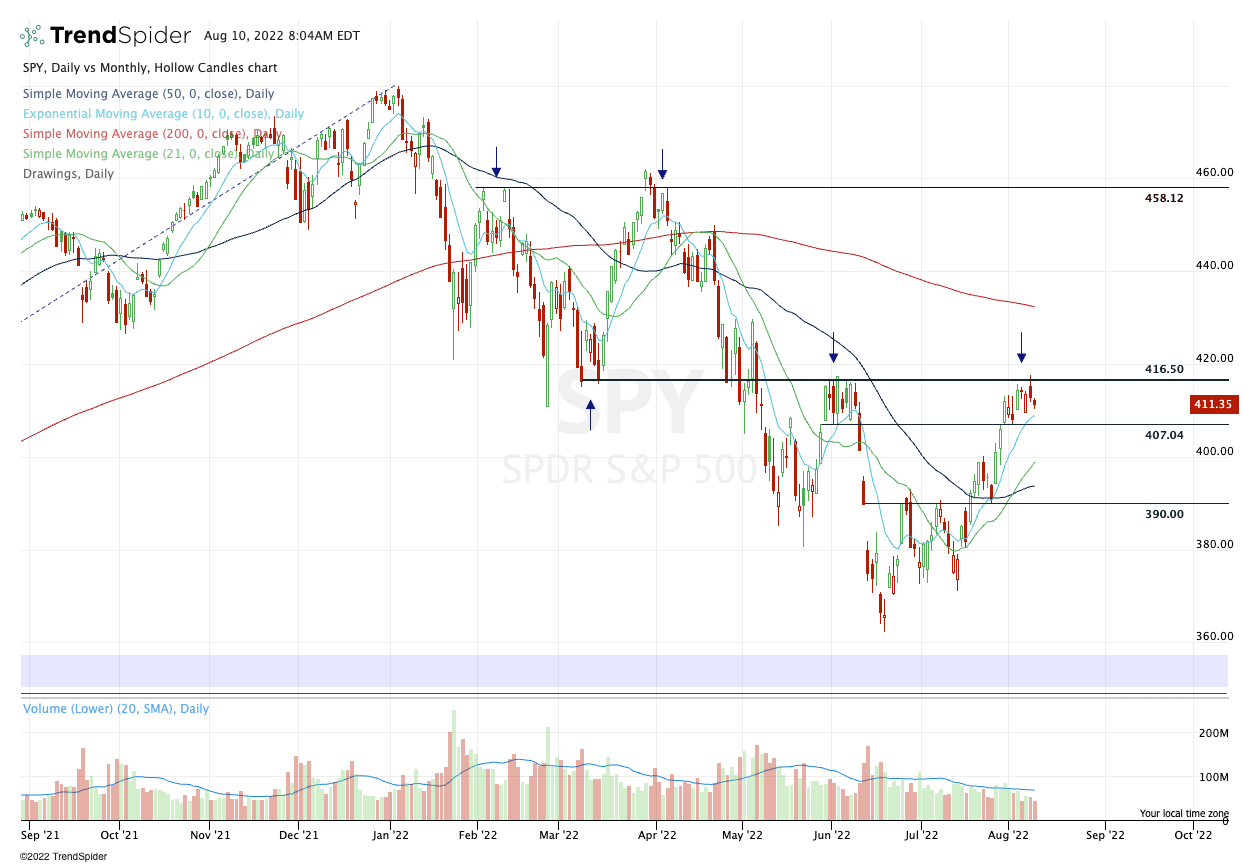
It’s the same thing as the ES. Bulls need $416.50+ on the upside and bears need sub-$407 on the downside.
Last week’s low is down at $406.82 (weekly down rotation).
Last week’s high is up at $415.68 (weekly up).
Nasdaq — QQQ

Nice trade yesterday on the QQQ and NQ, as they held right where they needed to: The 10-day ema.
From here, the CPI report will likely determine whether short-term support holds or crumbles. If it holds, a rotation back up to the $325 area is likely in the cards.
If it fails, we have $307 to $308 in play, followed by $296.50-ish.
Nasdaq — NQ

Held exactly where it needed to on Tuesday. Now it’s game-time for the CPI. do we get a rotation back to the upside that puts 13,350 back in play or a break do the downside, which could open the door down to the 12,500s?
Above 13,420 (this week’s high) could have 13,650 in play. Below 12,500 without reversing back to the upside puts 12,100 to 12,220 back on the table.
Go-To Watchlist — Individual Stocks
*Feel free to build your own trades off these relative strength leaders*
- Numbered are the ones I’m watching most closely.
- Bold are the trades with recent updates.
- Italics show means the trade is closed.
Trade Sheets: Now have 2-3 live trades, all with breakeven or better stop-losses. Great stress-free position to be in as we try to squeeze a bit more of upside out of this move.
- MCK — $355+ achieved. Entry from low $300s. Kudos for the patience!
- PEP — We got out Target No. 2 at $177. Either all out now or down to ⅓ of a position if playing for a breakout. Stop at $172 (above B/E).
- UUP — $28.60 to $28.80 is ideal first trim zone, but bulls can trim ¼ at $28.50-ish if they’d like, as the UUP runs into the 10-day ema.
- CHNG — Trimmed a little over ⅓ of position into our first target of ~$24.50. Inching stop-loss up to $23.50.
Relative strength leaders (List is cleaned up and shorter!) →
- O — Target No. 1 at $74. My stop was too tight on O.
- CNC
- HRB
- ENPH — kickstarted the rally in Solar
- TAN
- FSLR
- MSTR
- LNG
- PWR
- CHNG
- COST
- PEP — trade is live
- BA
- UNH
- XLE
- MCK — trade is closed
Economic Calendar

As we all know, there’s no crystal ball when it comes to trading stocks, options, or futures. But the Market Imbalance Meter may be as close as it comes. Knowing how the “Big Money” is placing its bets can give our trading room a big wave to ride — or a warning sign to stay out of the water. Come check it out now, risk-free for 30 days.
Comments are closed