Yesterday’s rally blew the bears’ socks off.
Follow @MrTopStep and @BretKenwell on Twitter and please share if you find our work valuable.
Don’t Forget: The Long-term performance of the S&P 500, some longer-term setups, and 5 red flags that showed up before the 2022 bear market.
Our View
To say yesterday’s rally on a small down-tick in the CPI was an overreaction is a bit of an understatement. But that’s how things work in today’s markets.
The S&P rallied 208 points yesterday and the 2-year yield had its biggest slide since 2008. Gold climbed $40/oz and is now up more than $150 in just a few days, while crude is up $3 currently.
I have said that we have never seen anything like this type of movement and I will say it again. Not in 1987, not in the 2000 tech bubble, the 2008 credit crisis, the Flash Crash or the March 2020 Covid 19 drop.
I have said it hundreds of times: I am not an economist and I do not pretend to be smarter than you or anyone else, but over the years I have seen just about every type of stock market move and nothing even close to yesterday’s 200+ point rally in the S&P. For what it’s worth, the PitBull agreed with me. Clearly my saying that “these are not our fathers markets or charts” is an understatement.
We figured the ES was going to make a big move after the CPI number, but with so many big shorts and hedges and stops above, the S&P went into the largest single-day buy program in its history. As we pointed out in yesterday’s Opening Print, the MrTopStep imbalance meter has bought over $16 billion in MOC’s over the last several trading days and yesterday’s $2.4 billion added to the ongoing buying that has been put to work.
Note: We have now added the MIM data below and will continue to add/tweak info around this powerful data set. I don’t personally know anyone who has access to the MIM data like we do.
Our Lean — Danny’s Take
Is the Low in? All I can say is I hope so, but the ES is going to be up against stiff resistance at the 4100 level. Should it get above there and hold, it could very well target the 4300 area, but I’m an old school guy and in these types of markets I prefer to take it one day at a time.
While I think higher prices, MrTopStep has a trading rule that says the ES tends to go sideways to down after a big rally. It’s also FRYday and we all know that tends to be one of the most volatile days of the week.
Our Lean: After yesterday’s huge gain, I don’t want to chase a gap-up, which is what we’re looking at as of 8:00 a.m. ET. Unfortunately, I’d much rather buy an opening dip, but what can you do?
On the downside, the bulls have to hold the 3930 to 3940 area as support. If it breaks, it opens up 3900. The 50% retrace of yesterday’s range is 3874.50. On the upside, 4000 is a huge upside target. Bret outlined it yesterday, so the Globex retreat from 3997.50 should surprise nobody.
Above 4,000 and we could easily be talking about another 50 to 60 handles on the upside.
MiM — Where’s The Money Going?
| Up | Down | Flow in Billions ($) | |
| Last 20 Sessions | 17 | 3 | $18.00 |
| Last 10 | 9 | 1 | $9.70 |
| Last 5 | 5 | 0 | $6.80 |
Equities had their first outflow in several weeks, but the MOC orders continue to pile up on the BUY side.
**Above is a table of the MIM data, which shows where the MOC money has been flowing over the past five days (week), the past 10 days (two weeks) and the past 20 days (past month).
Technical Edge
- NYSE Breadth: 86.2% Upside Volume
- Advance/Decline: 89.8% Advance
- VIX: ~$23.60
The Nasdaq climbs 7.3% and the S&P climbs 5.5%, yet we can’t drum up a 90/90 upside day on breadth and Adv/Dec?
That’s somewhat bothersome on the bull side. In any regard, I have a thought:
After yesterday’s report, my gut said that the Fed would ease the pace and size of its rate hikes. That now seems to be the case.
In just a few hours, we went from odds of 50/50 for a 50 bps hike vs. 75 bps hike in December, but now those odds stand at an 83% chance for a 0.5% increase. Admittedly, the Fed will need more than one lower-than-expected inflation report to tap the brakes (pivot). And while I’m not a macro-economist, some things are starting to line up.
My thought is much simpler than the macro theories. I’m seeing:
- The uptrend in the dollar has failed.
- Yields are coming down and the downtrend in bonds has failed.
- A smaller rate-hike is expected for December (although, it’s still a rate hike).
- The anticipation of a less hawkish Fed could drive equities higher even if the Fed hasn’t actually pivoted yet.
- This is a biggie: Think of all of the funds that are underwater and/or underperforming the S&P 500 this year. What better way to make up that performance than a big rally?
Simple approach (but not for everyone’s strategy):
For those that want to be outright long and position for a larger rally, consider buying a dip in the next 1-3 days and parking a stop-loss against this week’s low. I don’t know what kind of dip we’ll get, but seemingly every time the market rallies this hard, we do get one within a few days.
S&P 500 — ES

“3928 is the 2x weekly-up level. If we see that today or tomorrow, we could be looking at a move to 4000, then to 4050-60 and the 200-day.”
I did not think we would rally so hard yesterday, but who would have? We nearly tagged 4,000 in Globex and the S&P would be doing us a favor if it’d ease up a bit and give us a chance to get long.
It did provide some dips yesterday to the 10-ema on the 5- and 10-minute charts, so I’m grateful for those opportunities.
Bigger Picture: It’s simple. The ES must hold 3925 to 3930 to remain bullish.
On the upside, 4060-ish is in play if it can get above 4000, but that’s a big, big round number for traders right now. I would still expect an initial “sell” at 4000, even if it’s just for 10+ points.
ES — The Trade
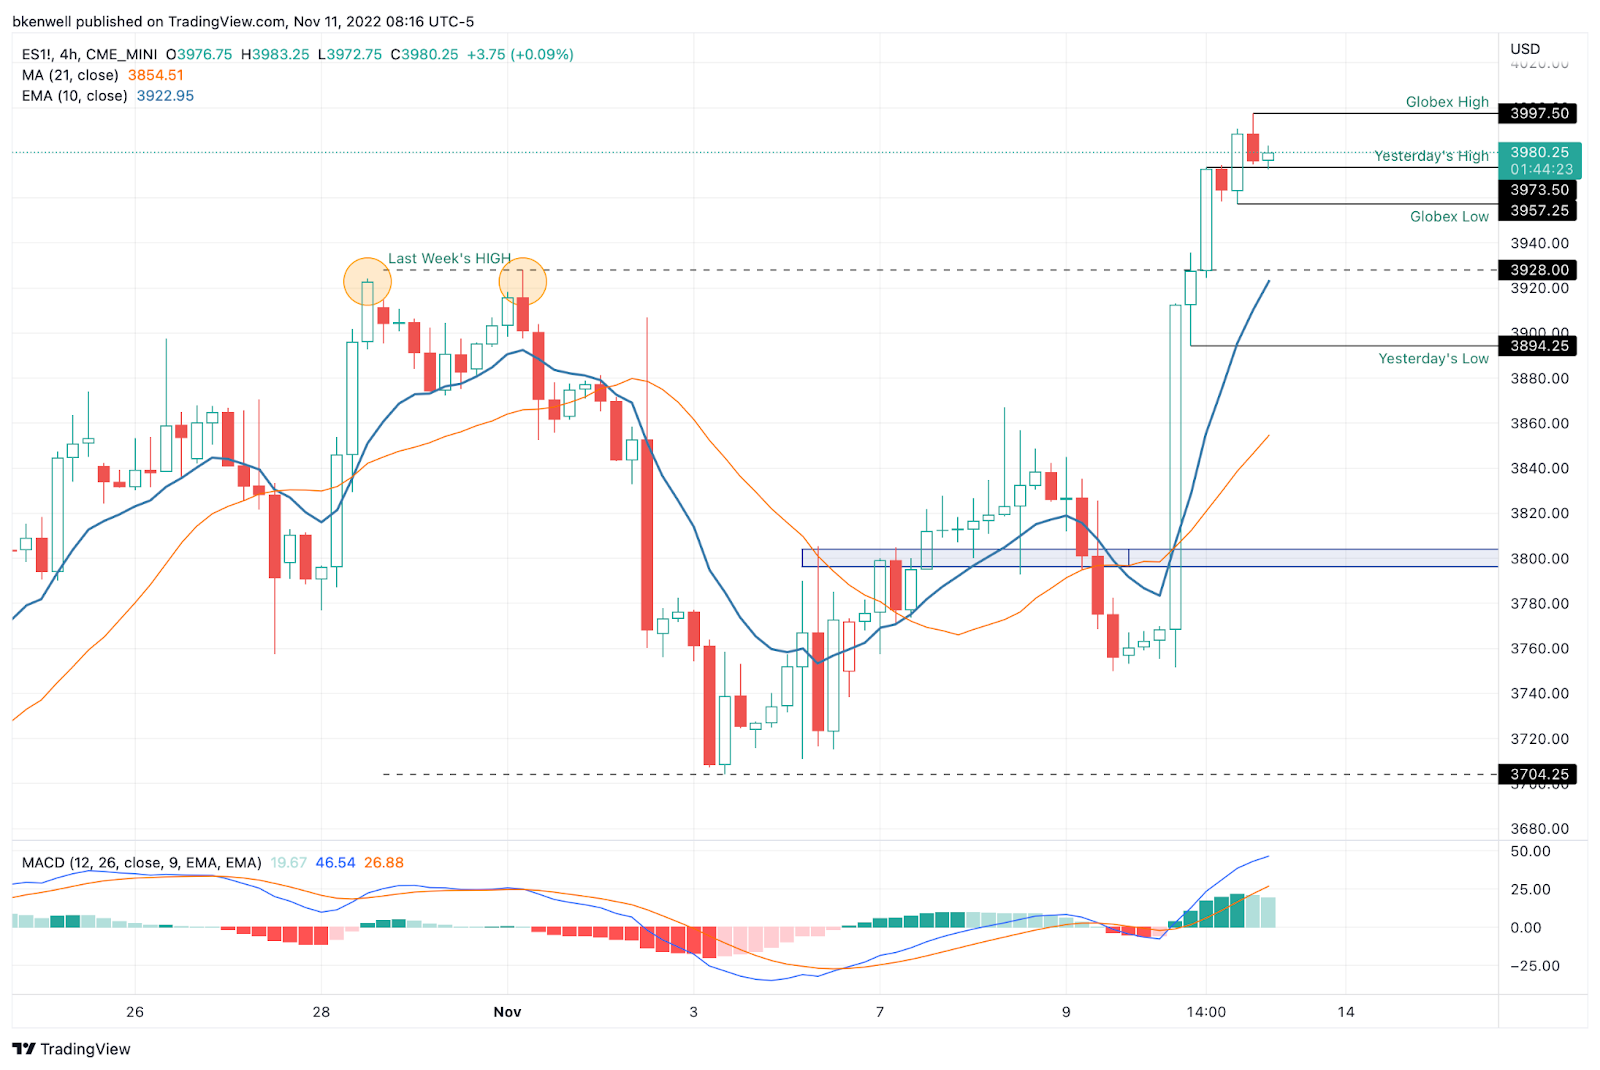
It’s hard for me to buy the S&P on a gap-up after a 200-point rip. Instead, I’d love a pullback to ~3925, +/- a few points.
There we would have the 10-ema on the H4 chart and the high from the last two weeks.
SPX (SPY)

As for the SPY/SPX, I am watching the 30-minute and H1 charts.
I want to see if we can even get a dip to the 10-ema on the 30-minute chart, especially if it lines up with yesterday’s intraday resistance near 3925. If we don’t get it, we may need to settle for playing the 15-min charts.
If we do get a bit of selling pressure and support does not come into play on the 30-min chart, then the H1 10-ema has my attention. Especially if it lines up with last week’s high near ~3912.
SPY — Daily

SPY needs to hold $390 and dips to this level can be bought — for now.
TLT

Bonds have been trapped in a brutal downtrend, but yesterday’s move vaulted it over this area.
I’m half tempted to buy today’s pullback to $97.50-ish and stick a stop against the 2022 low (call it $91.50) and just risk $6. The ideal buy would be ~$96, as it’s against the 10-day and 21-day moving averages. Those should hold if bulls are going to take control.
It will have a big test at $100 (recent resistance + the 10-week & 50-day moving averages) and like everything else that was or is in a downtrend, it will have more tests beyond that if it pushes higher. Still, there’s an attraction to having a defined-risk setup.
BMY

Keep a close eye on ~$78. If bulls are going to remain in control of BMY, they will hold this level. I don’t want to see it below $76.25 (last week’s low).
If it sets up and bounces, traders can trim on $80 to $81.
MCK

MCK has treated us so, so well this year, that I feel greedy looking at it again. But yesterday’s ~4% dip into the $370 breakout area and 10-week moving average has my attention.
If it can open below and regain $372, we may see a push back up toward $380 and the mid-$380s. However, I’m struggling with the best entry here.
I would love a tag/break of yesterday’s low and a reclaim to get me long. Even a test of the 50-day would be okay, so long as it holds. In that area we also have the daily VWAP measure and the 61.8% retrace.
This stock has been the epitome of relative strength.
Below $360 and I’m uninterested.
Go-To Watchlist
*Feel free to build your own trades off these relative strength leaders*
- Numbered are the trades that are open. g
- Bold are the trades with recent updates.
- Italics show means the trade is closed.
Open Positions
- GIS — Down to ⅓ to ½ after $82 trim. Next trim is $85 to $86, but seems less likely given the climate. Stop at $78 if you’re still in.
- MCD — “This stock has not touched its 10-day moving average in almost a month.”
- Trim some $275/$276. Can be down to ½ position if we see $277-278
- Can still look to buy $271/the 10-ema
Relative strength leaders →
Top Picks (these have been Robust lately). Money rotated out of the winners and into beaten-down tech, as you can see many growth stocks roared yesterday.
- LNG
- MCK
- CAH
- TJXm
- CI
- CCRN
- GIS
- LPLA
- REGN
- ENPH, FSLR — solar has strength
- VRTX
- UNH
- MRK, AMGN
- XLE — XOM, CVX, COP, BP, EOG, PXD
- NOC
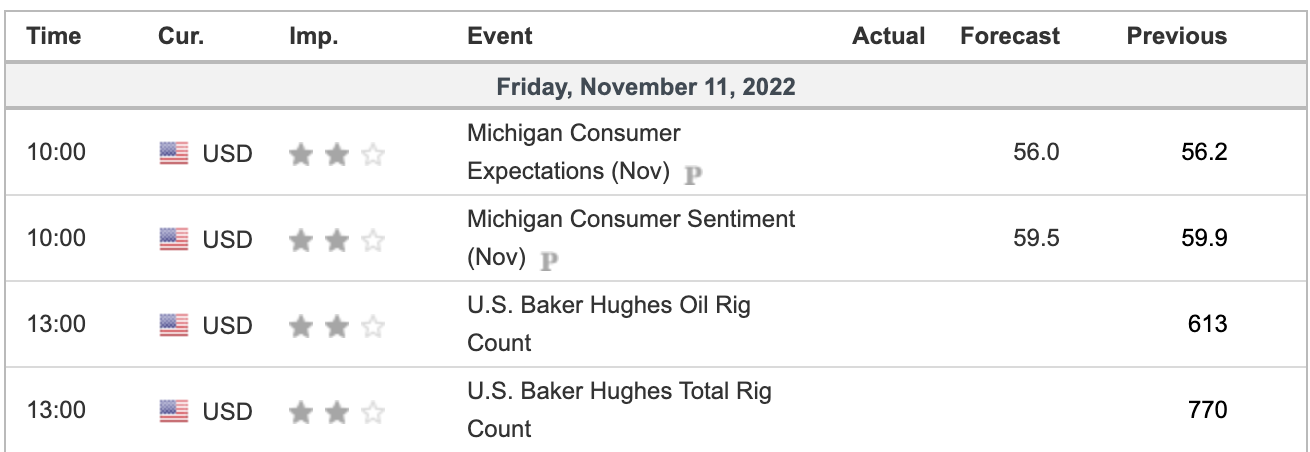
Economic Calendar
Comments are closed