How we’re trading the day, plus ARKK, COST, TSLA, and more
Our View
After one of my best trading days of the year, I gave over 50% of my profits back. I bailed under 4669 once the ES broke the 50% retracement at 4672. Everyone (including me) is looking to hit the home run and the reality is, I should have bailed on the futures early in the day. This is the second time in a few days that I got too bullish after a big rally.
Our Lean
The statistics say today should be up, but that doesn’t mean it won’t come without some pain and suffering.
While I remain bullish, I don’t think all the 100-point daily swings are a good omen. Eventually, the train will come off the tracks, but I don’t think that happened Thursday.
The funny thing about yesterday? On early Thursday morning, I had the largest 24-hour profit since I was on the trading floor and all I could think of was making more. That’s not the way to go. What I should have done was exactly what I have been talking about: Selling half the position and trying to buy it back on a dip…but the dip was just too big.
It’s absolutely crazy what’s going on, with the 100-point ranges almost every day.
I started writing about how the recent moves in the ES resemble the 2008 credit crisis, but I pulled it out of yesterday’s OP. I know it’s not the same, but I remember weeks and weeks of extreme volatility that was nonstop.
Raj from BofA’s book was so big that he was forced to trade hundreds of thousands of OEX, SPX, SPY, and S&P futures. When the markets were up, he would have to buy futures to protect his short book. When the markets were down, he was selling to protect the long side of the book.
I also did all the AIG business and wanted the position to go from 80,000 ESUs down to 400 or 500 rolls.
As I said, it’s not the same, but all these big rips and dips spell “whip out” for the big accounts as they try to protect on the downside and mark up with winning positions.
So, where are we?
It’s only natural to have some level of doubt about the weakness, but I think the keynote is that the ES made its new high at 4743.25 at 7:00 am and despite trading down over 100 points to its session low at 4642, the futures are still only 78.25 handles off the high.
It’s easy to be bearish after Thursday and it’s hard to find the silver lining. But based on how the futures move, it could be right back up to the highs in a few hours. Will that happen? I don’t know. It’s been a really tough, long week.
Our lean is to take a more guarded approach — slow it down. The way this is looking, the ES may continue to chop back and forth until a few days before Christmas and again after, when “thin to win” should take over.
I am still long my calls and a few ES contracts and will be looking to buy a dip if the futures pullback in the morning.
S&P Daily Recap
I am not going to do a big play-by-play. There were just way too many twists and turns to keep up with, but I will do a small overview.
The ES rallied up to 4743.25, a new high and up 141 points from Thursday’s 4602 low. After the 7:00 am high, the ES sold off down to 4714.25 at 9:21 and opened the regular session at 4720.
While the ES popped higher on the open, the sellers stepped in fast and drove it down to 4702.50 in the opening 30 minutes. From 7 am to 2:30 pm, the ES fell in 14 out of the 16 30-minute windows.
The ES traded 4642 at the low at 2:55, down 60 points on the day, and 101 points from the Globex high. After the low, the ES rallied 36 handles up to 4677.75 at 3:39 and then traded back down to 4660.25 at 3:49. The ES traded 4659 as the 3:50 cash imbalance showed $300 million to sell and then ripped straight up to 4674 at 3:52.
The ES traded 4661 on the 4:00 cash close and climbed back up to 4467.50 as the NQ rallied, before settling at 4665.25 on the 5:00 futures close, down 37 points or 0.8% on the day.
In the End
I generally write the OP while the markets are open, but I just could not keep up on Thursday. The first part of the day was one small pop at the open, followed by 20 to 30 handle drops. After closing firm yesterday, Thursday’s tone was weak most of the day.
In terms of the day’s overall trade, 2.11 million futures traded on the day, the week’s fourth consecutive session of 2 million or more contracts.
In the end, the only thing I can say is “the market giveth and the market taketh it away.”
As we all know, there’s no crystal ball when it comes to trading stocks, options, or futures. But the Market Imbalance Meter may be as close as it comes. Knowing how the “Big Money” is placing its bets can give our trading room a big wave to ride — or a warning sign to stay out of the water. Come check it out now, risk-free for 30 days.
Technical Breakdown
- NYSE Breadth: 49.9% upside volume
- NASDAQ Breadth: 35.7% upside volume
Man oh man, these trading ranges are ridiculous (and exhausting). Obviously, everyone who reads this has different approaches to the market and to trading, but I’m glad that we’ve taken a “less is more” approach to the week.
You can’t burn through your different capital stakes — the dollars in your account and your mental capital. If you find yourself short on the latter, take some time off, even just for a day.
The up-and-down nature — the chop — has made it hard to be committed to a certain direction, up or down. It can be tough on trading accounts and really tough on our mental capital. Taking a “less is more” approach to the week was an effort to play defense on these two fronts and I think it worked well.
Further, it has us taking some of our profits quickly, raising our stops to break-even, and trying to keep our head above water.
The one thing I would note is that the NYSE had pretty strong breadth for most of Thursday’s session, ending near 50/50 despite the S&P finishing lower by 0.9%. The advance/decline ratio was a bit lower at 44%, but still better than I would have expected.
The Game Plan
Yesterday, I wrote:
“If [the S&P] can clear [the all-time high], bulls can start looking at upside extensions. The reality is that we don’t know how the market will handle a gap-up scenario. Does quad-witch have one last trick up its sleeve?”
Well, the ES did hit new highs during Globex before reversing hard. The S&P index didn’t quite get there, but it also failed to hold above 4720 resistance.
The plan all week has been not to do anything stupid — not to force anything that wasn’t a good setup. The bulls grabbed the wheel on Wednesday, but couldn’t maintain control on Thursday.
S&P 500

For now, the S&P 500 is holding the 10-day and 21-day moving averages and is just a few points below the key 4670 area.
A finish above these levels would be great for the week, but with a quad-witch expiration on deck, it really is impossible to say how the markets will finish the day.
A move below 4650 (and thus, the 21-day and yesterday’s low) that’s not quickly reclaimed, opens the door down to the 4600 to 4610 area.
**Just keep in mind that the S&P can run a lot of stops on a day like this, in both directions. It wouldn’t be out of character for the market to shake out the stops around key levels and reverse in the opposite direction.
Nasdaq

Pretty discouraging action on Thursday as the QQQ/Nasdaq have been having trouble finding traction vs. the Dow and S&P 500. That’s as growth stocks really take the brunt of the selling.
For now, the 50-day is holding up as support, but how long can the bulls lean on this measure?
It’s the third straight daily test and the fifth test of this measure in the last 10 sessions. You know what they say: The more times a level is tested, the more apt it is to fail.
If we bounce from here, let’s see if the QQQ can reclaim the 10-day and 21-day moving averages. Above $395 and the $397.50 to $398.50 zone will be on watch (the high from Wednesday and Thursday). That’s followed by $400 to $401 resistance.
On the downside, a break of the two-day low and $382.50 puts last week’s low on the table, near $379.
ARKK
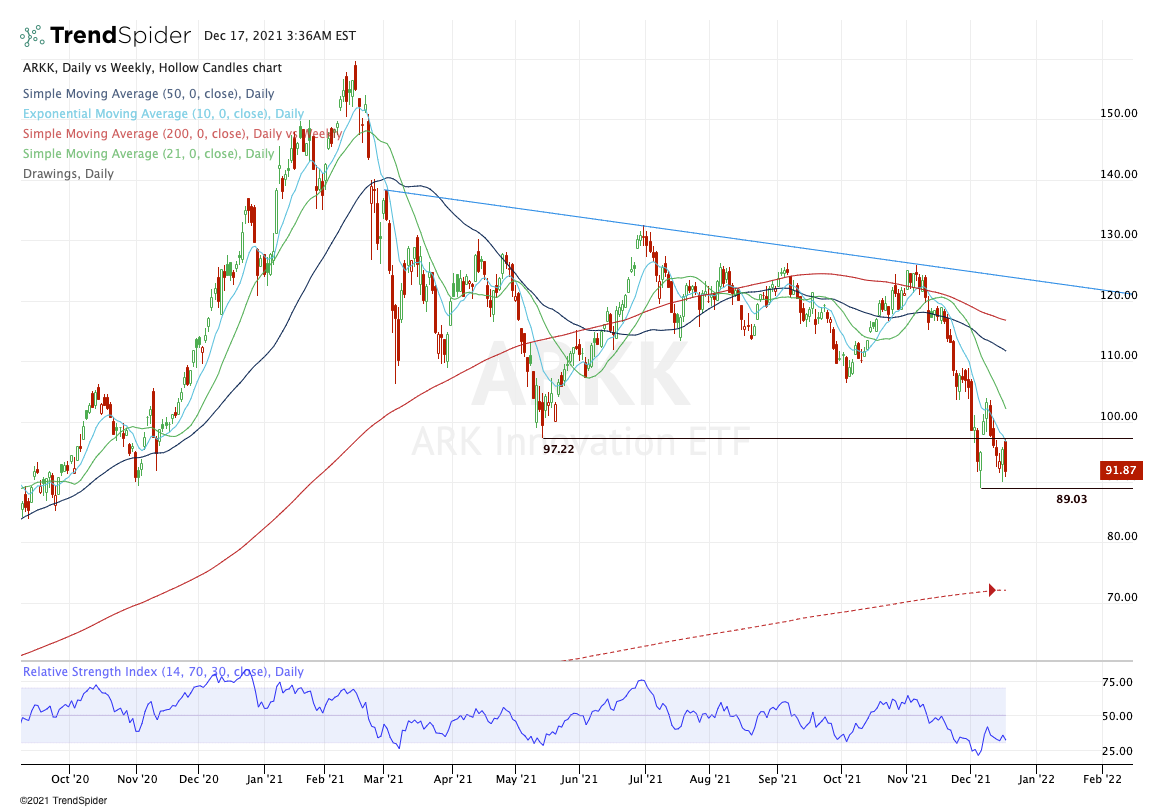
Easy come easy go.
On Wednesday, ARKK had its highest-volume day since May 2021 and gave bulls an impressive reversal off the lows. Then it gapped higher and rolled over on Thursday. This fits our “mixed tape/chop” observation of the overall market.
Clearly, the $89 level is going to be important. We had a sweet bullish reversal off this low back up through $100, but bulls couldn’t maintain momentum.
On the upside, ARKK needs $97+
On the downside, we need to see it close above $89, even if that means cracking below it and running some stops first. If we break $89 and sustain below it, does it eventually open up ARKK to the 200-week moving average?
The thought of it makes it scary to think of what could happen to individual growth stocks, which have already been battered.
Individual Stocks
As far as individual stocks go, I’m not looking to get too specific. We’ve done really well this week with our picks and there’s no need to be a hero on a quad-witch Friday.
We had the Apple bearish reversal and the rotation higher in Pfizer on Monday, and the big bounce in Nvidia and a handful of growth stocks mid-week.
For today, I’d rather watch the indices, ARKK, and a few others.
I want to see how they trade on the day, which takes initiative and how we close so that over the weekend I can get a look at some fresh weekly charts going into the last two weeks of the year.
As for individual stocks though, I am watching a couple.
- PG remains at the top of the list, now up 7 days in a row. On pullback watch now.
- COST broke out over $561 but failed to stick the landing. So I am watching the 10-day on the downside for support. On the upside, a move back over $561 puts the high at $566.50 in play. Above that and a larger move higher can take place.
- QCOM had a bearish engulfing candle yesterday. A gap down to the VWAP near $174.50 and a bull reversal could be enticing for a long trade, even just for some daily cash flow.
TSLA has a gap-fill at $910 and the prior all-time high near $900. See if that zone attracts some buyers and/or some short-covering.
Disclaimer: Charts and analyses are for discussion and education purposes only. I am not a financial advisor, do not give financial advice, and am not recommending the buying or selling of any security.
Remember: Not all setups will trigger. Not all setups will be profitable. Not all setups should be taken. These are simply the setups that I have put together for years on my own and what I watch as part of my own “game plan” coming into each day. Good luck!
Economic Outlook

Comments are closed