Our View
People are stressed and worried. Maybe I am wrong about things being disjointed and it’s just the impact of a global impact on the public’s mindset. Higher rates, recession fears, crude oil nearing $115, the war in Ukraine, and the China lockdowns — it’s all weighing on people’s minds and the markets.
I refuse to believe with everything going on that the stock markets are going to be quiet over the summer! Gas prices are going to rise as more families hit the road. Add to that the Fed is willing to thrust us into a recession to combat inflation and this is not a good environment for stocks.
While the short-term bias is to the upside, the two-way price action should continue. Meaning if you sell them wrong or buy them into a pop you may end up on the other side of a 30 to 40-point move. Risk management is imperative in this type of tape.
We all know based on the size of the daily ranges that if you pick a low or high it should be good for a 50-point move.
Our Lean
We avoided pulling out the MrTopStep trading rule that says the ES goes sideways to down over the last few days. However, after a four-day, 240-handle rally and closing on the high yesterday, we have to use it.
I’m not a big believer in a big extended rally. In fact, the levels I’m watching are 4120 and 4140 on the upside and 4020 to 4060 as support. Our lean is to buy the early weakness and sell the rallies.
Daily Recap
The ES opened Tuesday’s regular session at 4068.75, traded 4070, and sold off down to 4047.75 at 9:55. From there, it rallied to a lower high at 4065.50 and then dropped 35 points down to ~4030 at 10:46. The ES traded up to 4064.50 at 11:38, sold off down to 4050 at 12:11, and traded up to a new daily high at 4079.25 — the high ahead of Powell’s comments around 2:00.
The ES traded down to 4039 as the Fed headlines hit the tape, but then rallied all the way up to 4089.75 at 3:03, up about 50 points. After the pop, the ES sold back off down to 4070.75 at 3:47 and traded 4074 as the 3:50 cash imbalance showed $272 million for sale. It rallied up to 4087.25 and traded 4083 on the 4:00 cash close and settled at 4090.50 on the 5:00 futures close, up 85.75 points or +2.14% on the day.
In the end, the best trade was buying the 30- and 40-point drops. In terms of the ES’s overall tone, the ES was being bought on the dips. In terms of the ES’s overall trade, volume was steady at 1.665 million contracts traded.
- Daily Range: 91 points
- H: 4091.50
- L: 4000.50
Technical Edge
- NYSE Breadth: 84% Upside Volume (!)
- NASDAQ Breadth: 79% Upside Volume
- VIX: ~$26.75
We had a 90% upside day on Friday, a digestion day on Monday, and now an 84% upside on Tuesday. Another 90%+ upside day would have been more meaningful, but these “demand days” are nice to see.
Game Plan — S&P (ES and SPY), Nasdaq (NQ and QQQ), Individual Stocks
We are positively pleased we were bullish coming into Friday, saying there’s an “urge to surge” and “Let’s run the buy stops.” However, we can’t forget about the current trend, which is down. So in that light, we may continue higher and we may finish higher this week, but at the end of the day, this is likely just a dead-cat bounce.
That mindset changes if we can form some sort of sustainable uptrend. But until that happens, this really just looks like a bear-market rally.
S&P 500

We got what we were looking for with the push from sub-3950 up to the 4080 area. But now we need to see how the ES handles the 4100 to 4135 area. In this zone, we have prior support turned resistance, as well as the 61.8% retracement and the declining 21-day.
The short-term trend is higher right now, while the long-term trend is lower. That’s something we must balance delicately.
On the downside, bulls want/need to hold the 4035 to 4055 area. This area has multiple key measures to respect and if that’s not the case, 4000 or lower could be on tap.
***
The “bigger picture” scenario is if we can clear all of the overhead resistance, say by clearing 4150. That’s what really opens the door to higher prices, potentially putting 4250 to 4300 on tap.
FWIW, that would be an opportunity to unload longs and/or get short, IMO.
SPY
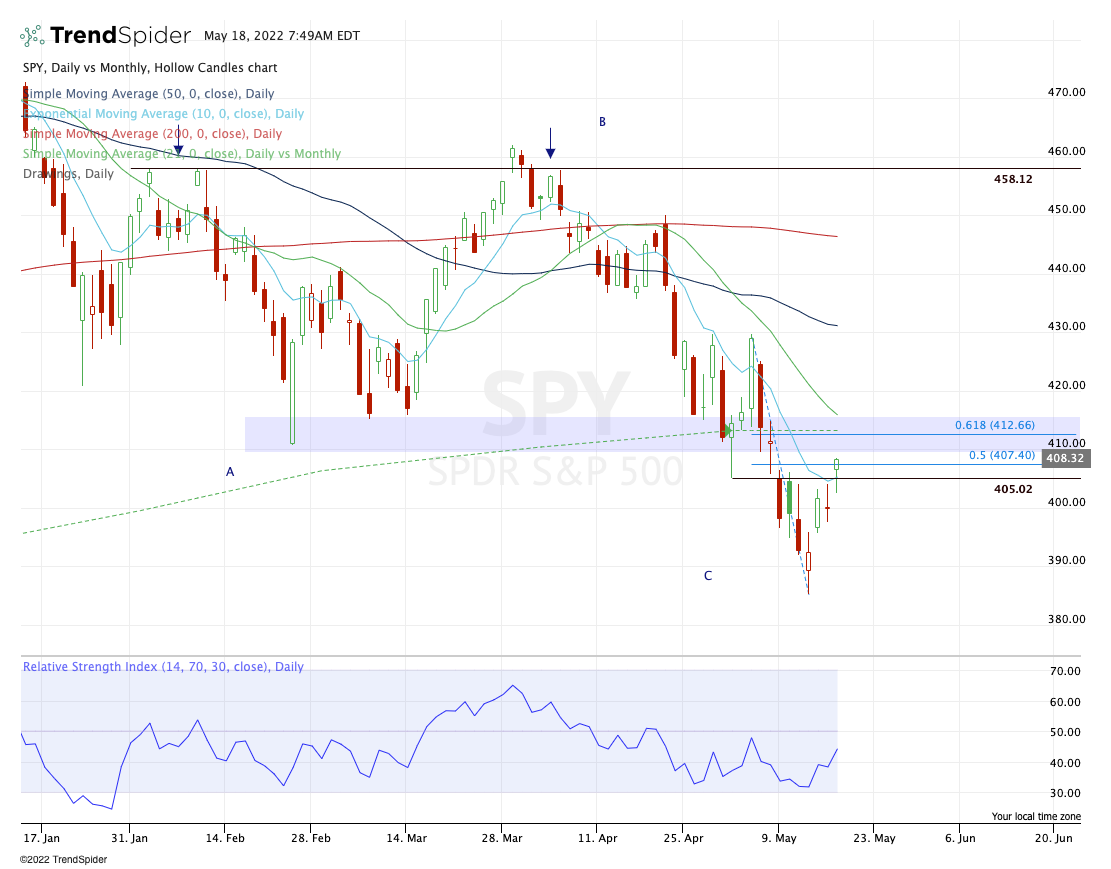
SPY is similar to ES, in that we got our tag of the 50% retrace and a very strong close. However, we are gapping down below the key $405 level in the pre-market.
Recover that mark and the bulls can keep the trend intact. Fail to do so and Tuesday’s low remains vulnerable at $402.58. Below $400 and SPY becomes quite suspect — again.
On the upside, a move above Tuesday’s high opens the door to the $412 to $413 area, where we find several key areas.
***
If SPY can shake off all this bad news and really burst higher, the $425 to $430 area could be in play, but don’t get too bulled up unless we can clear the 21-day.
Nasdaq — QQQ
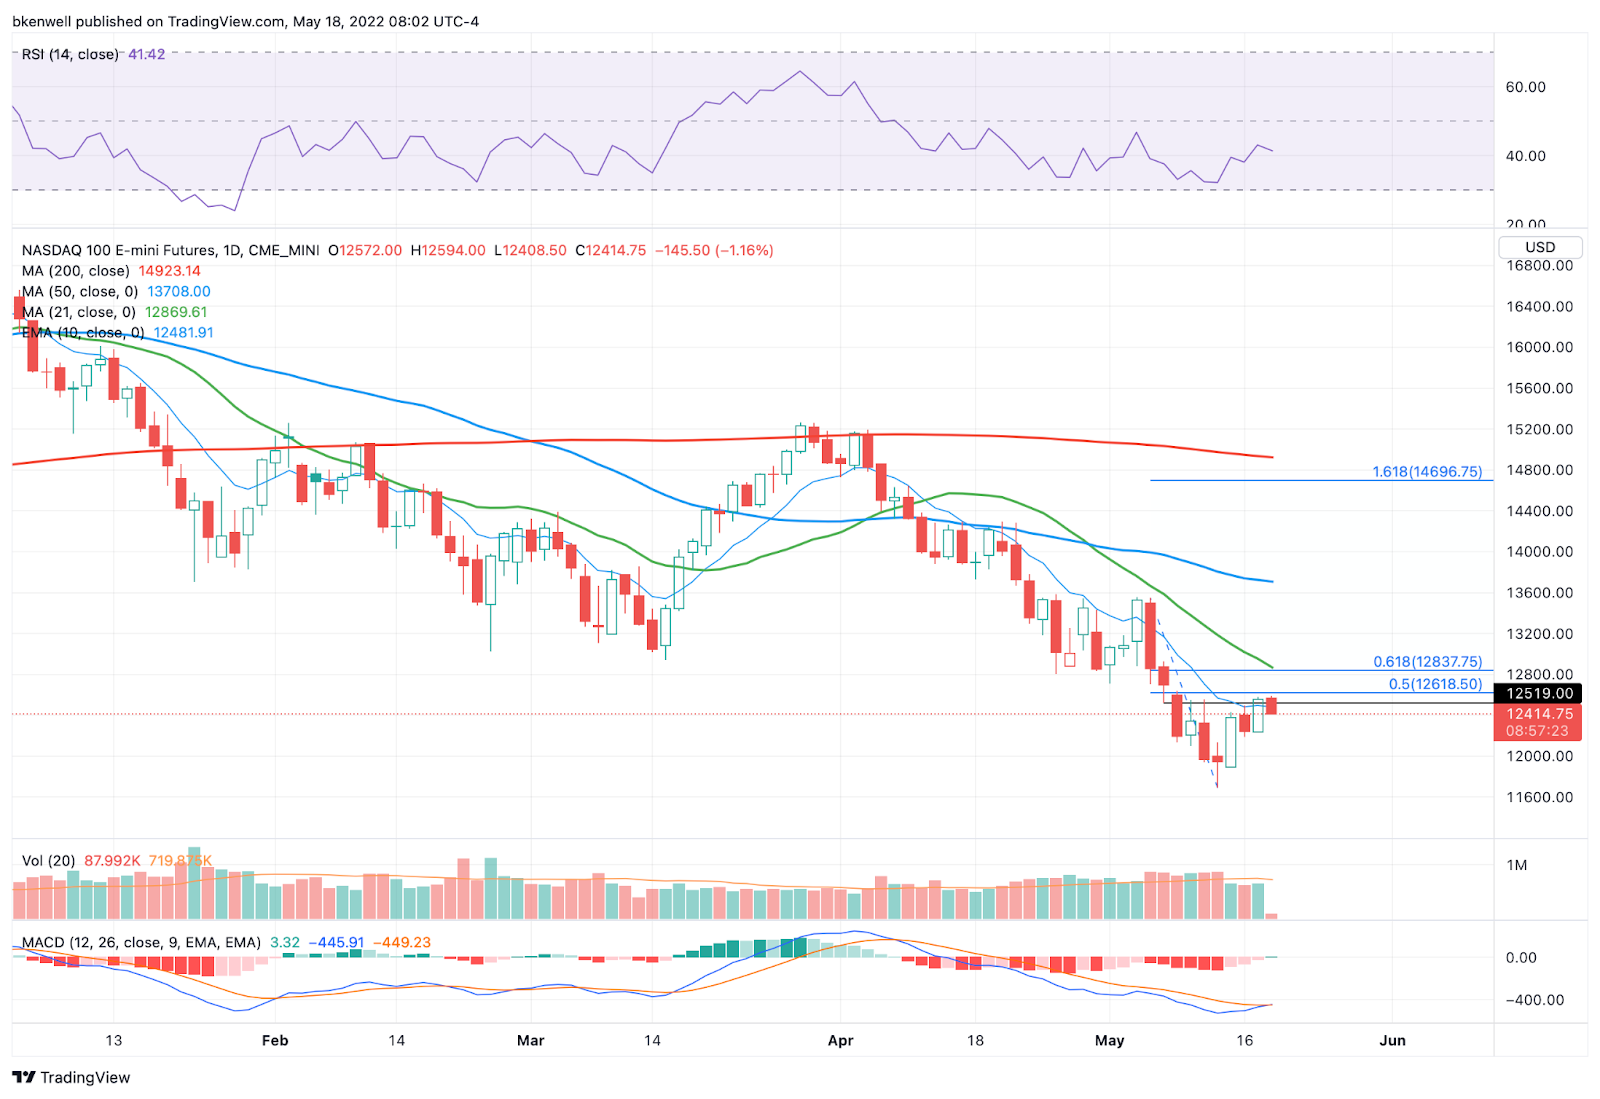
Watch 12,350 to 12,400 on the downside. That’s the 61.8% and 50% of yesterday’s range, respectively. Losing those levels opens the door down to the 12,200 to 12,235 area.
On the upside, a move above 12,620 opens the door up to 12,800 to 12,850, where the NQ finds a key retracement and the declining 21-day. #KISS
Nasdaq — QQQ

Like SPY, the QQQ is trading below a key level at $305 in the pre-market. Bulls want to reclaim that, but even more so, they want to hold yesterday’s low at $300.55. Below $300 and we have to start looking at lower prices.
On the upside, a move above $306.50 opens the door to the $310 to $313 range.
Oil — CL
No change vs. yesterday’s outlook.
Amazon

I really went back and forth on sending an update yesterday afternoon for AMZN as it flirted with a weekly-up move over $2080. The weekly looks attractive for a bounce, but the daily chart looks bearish.
In any regard, AMZN is gapping lower on TGT’s results as inflation continues to create issues. AMZN is trading ~$2250 the pre-market now.
If AMZN holds this week’s low at $2225 and goes weekly-up again at $2080, bulls can look for a potential rotation long here. It keeps our risk defined near this week’s low. Our first target can even be Tuesday’s high (ish), although $2400-$2500+ would really be the desire here.
MDRX

Not much to act on yet, but a very tight weekly setup forming here on the 50-week sma.
Go-To Watchlist
*Feel free to build your own trades off these relative strength leaders*
Numbered are the ones I’m watching most closely. Bold are the trades with recent updates.
- AR — Target No. 2 at $36 was hit. → B/E stop with $38.50 to $39 as our final target unless want to play for a breakout over $40.
- ABBV — Weekly up → $148.75 seems like a reasonable stop-loss level. $150 for more conservative traders. On the upside, I’d love $160 to $162 as our first trim. More conservative traders can trim at $157. Conservative trim hit.
- XOM — this target hit “Above $92+ and feel free to trim as much as you want.”→ B/E stop on the remainder of the position. $96 to $97 is a big extension area if it can really get going.
Relative strength leaders (List is cleaned up and shorter!) →
- XLE — A nice run here. Let’s start looking at pullbacks to buy.
- AR
- PEP
- KO
- MCK
- MRK
- BMY
- JNJ
- DOW
Economic Calendar

As we all know, there’s no crystal ball when it comes to trading stocks, options, or futures. But the Market Imbalance Meter may be as close as it comes. Knowing how the “Big Money” is placing its bets can give our trading room a big wave to ride — or a warning sign to stay out of the water. Come check it out now, risk-free for 30 days.
Comments are closed