Friday’s action is set for a gap down.
Follow @MrTopStep and @BretKenwell on Twitter and please share if you find our work valuable.
Our View
When the markets speed up, as traders we must slow down. That means:
- Remember that cash is a position.
- Sit on our hands and only take the best setups.
- Zoom out and look at the larger trends that are in play rather than getting caught up in the chop.
- Rule No. 1 is preserve capital — that’s account capital and mental capital!
Over the last week, we have been sending a lot of resources alongside the newsletter.
- Last week, we had a 10-minute video highlighting how and why the S&P may be lining up for a further push to the downside.
- Earlier this week, we noted the long-term performance of the S&P 500, for perspective.
- Yesterday we sent out a piece on a few longer-term setups since we have pumped the brakes a bit on short-term setups.
- Notice how we had many great individual stock trades in the summer, but the last portions were stopped out. That told us the setups are turning and the market is saying “caution.” It was prudent for us to ride the winners and get out while we could.
Bonds tanked and the dollar spiked yesterday, but the market held up pretty damn well until the final 10 minutes of the day. After the late-day selloff, that selling pressure has trickled into the Globex.
Our Lean — Danny’s Take
“Goldman Sachs has cut its year-end 2022 target for the benchmark S&P 500 index by about 16% to 3,600 points, as the U.S. Federal Reserve shows little signs of stepping back from its aggressive rate-hike stance…Their previous target was 4,300 points.”
We’re going to keep the Lean short and sweet: We are looking for lower prices, but as always we can’t rule out some short-covering rallies, especially if we open up where we are trading right now (the ES is trading roughly 3720 as of this writing).
We have not been bullish for most of this year and so to see the market starting to crumble again is not that surprising. Check the charts below for the exact levels.
Daily Recap

In the end, the ES did sell off but it was a choppy trade. In terms of the ES’s overall tone, it was weak and a high level of sell programs. In terms of the ES’s overall trade, volume was low until late in the day at 2.53 million contracts traded.
- Daily Range: 69.5 points
- High: 3833
- Low: 3763.50
Technical Edge
- NYSE Breadth: 23% Upside Volume
- NASDAQ Breadth: 28% Upside Volume
- VIX: ~$29
Game Plan: S&P, Nasdaq
Don’t forget, we have Powell at 2pm.
S&P 500 — ES
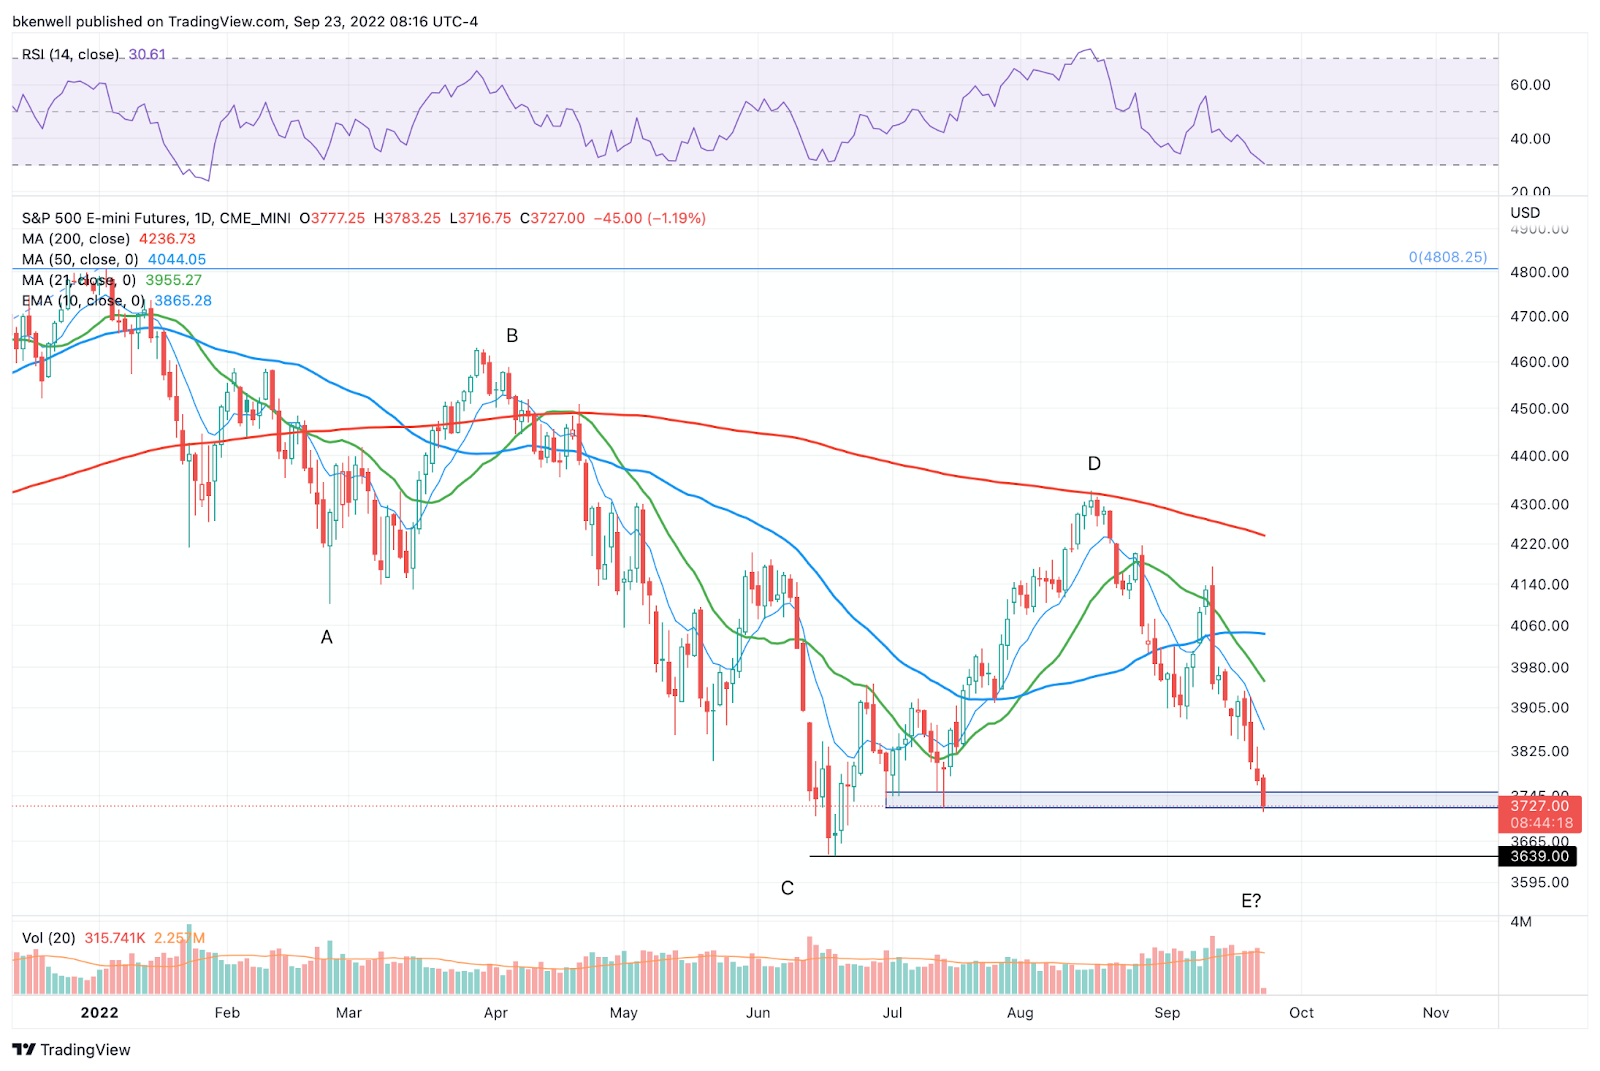
On the bigger picture setup, we have been waiting for a potential break back down to the contract lows. However, I would be a little surprised here if we don’t see some sort of bounce/stability near the 3725 to 3750 area — even if just temporarily. That was very solid support in July, with each dip being bought up at the time.
If we do bounce, watch the short-termer timeframe trends (noted below under “ES — Zoomed In”) as potential resistance areas. After all, we’re opening significantly lower, so a bounce wouldn’t be surprising.
If we don’t bounce, it would say a lot about the current market and put 3700 or lower is in play. The contract lows are down near 3640.
ES — Zoomed In

I use multiple timeframes during the day. Usually the 15M, 30M, H1, and H4 setups, along with daily and weekly to get a sense of the various trends.
Above is the H1 and H4 looks, where you can see how the 10-ema has been resistance. On the H1 chart specifically, the 50% to 61.8% retrace zone of the Globex range is 3750 to ~3758.
If we clear 3758, yesterday’s low really becomes of interest, specifically the 3763 to 3770 area. Unless reclaimed, that’s a sale zone.
I know this is sort of “generally speaking,” but keep an eye on some of these key areas above and see how the day develops.
SPY

Bonds have been signaling caution for a while now (since Aug. 8), the dollar has been strong and Powell just told us the other day “Higher for longer” when it comes to rates. That’s some bearish stuff right there!
As the days go by, another support seems to vanish.
Now set to gap lower on Friday, the gap-fill level from mid-June is in play from $369.38. If the SPY bounces, watch yesterday’s low around $373.50 up to $374 as a possible sale area.
Below the gap-fill level at ~$369.40 and failure to bounce opens the door down toward the lows. To get there today would require a 3.22% drop. Not impossible, but that’s a big fall.
Nasdaq — NQ

“A sustained break of 11,550 puts the 11,425-ish area in play, +/- 50 points.”
Well, here we are at 11,400.
Kind of like with the S&P, this area is definitely a potential bounce zone. Or put another way, if the buyers are going to step up, this would be the area to do so.
If they don’t, 11,050 to 11,100 is the eventual downside target. If they do bounce it, 11,500 to 11,550 is potential resistance unless reclaimed.
Nasdaq — QQQ

Let’s see how the QQQ does around the $277 area. If it can’t get back above it, the 200-week may be in play.
If we bounce this morning, there may be a potential sale opportunity in the $279 to $280 area.
MCK

I’m not really looking for individual trades right now, but MCK did catch my eye, potentially for next week on what would be an inside-and-up rotation (assuming today’s action isn’t too destructive).
MCK has treated us very well this year and it continues to hold up over the breakout level, which you may recall took a painfully long time to trigger!
Go-To Watchlist — Individual Stocks
*Feel free to build your own trades off these relative strength leaders*
- Numbered are the ones I’m watching most closely.
- Bold are the trades with recent updates.
- Italics show means the trade is closed.
Notes:
- UUP — Down to ¼ position as we hold for potentially higher prices. Raise stops to $28.40 to $28.50. Look for $30 on the last piece.
Relative strength leaders →
Top:
- ENPH
- LNG
- MCK
- CAH
- FSLR
- TAN
- ALB
- TSLA
- VRTX
- CYTK
- XLU
- XLE
- BMRN (weekly/monthly)
- PWR
- CHNG
- CELH
- UNH
Economic Calendar

Comments are closed