A Quick Word From Danny Riley:
Since we opened up the new Opening Print newsletter, more than 1,000 people a day are reading it. I think the newsletter speaks for itself, as we have been navigating these markets incredibly well. We have been quite in tune with the ES and S&P 500 lately, as well as many individual names and commodities (like gold).
That said, we have been running an open door all month and will move back behind a paywall starting tomorrow. Alongside that move, we’re also launching a pre-Black Friday sale of 25% off our monthly and annual subscriptions. It will run until Nov. 24 before being reduced through Cyber Monday.
I don’t pretend to be a stock market analyst or a market timer. I went to the school of hard knocks — the CBOT and the CME — a place where even your good buddy will take advantage of you if you’re asleep at the wheel.
I am just a guy who has worked for not one but many of the top traders in the world — you just do not get to that level without persevering.
I can honestly say, I don’t know when the markets are going to correct. This is not like 1989, the 2000 tech bubble or the 2008 credit crisis. This is something very different, but we’re navigating it day by day.
I hope you have liked the full version of the Opening Print, as I have written it for almost 30 years. I understand the bad punctuation and run on sentences, but I also think what I set out to do is working — which is to share a feeling for the direction of the S&P! Not many people have put in the years that I have on the trading floors and are willing to still write about.
I do it because I love sharing my thoughts on the markets and on trading.
The Opening Print Recap
Guys and Gals, we have been navigating these markets quite well lately. Yesterday we had a very clear plan.
Our Lean was for higher prices and in the technical section, we laid it out clearly, saying: The ES needs to clear 4680, followed by the Globex high at 4687. That would put Monday’s high in play at 4697.50.
Let’s recap.
The ES traded up to 4679.25 on Globex, sold off down to 4670.75, and opened Tuesday’s regular session at 4676.25. From there, it down-ticked less than a point to 4575.50 and then quickly rallied 16 points up to 4691.50 at 9:38. It eventually pushed up to 4695 just after 10:15.
After the uptick, the ES pulled back to the VWAP at the 4685 area, then ripped higher up to 4704. From there, it back-and-filled for the next hour before rallying up to a new high at 4706.75, just 5 points away from the old high.
After a small drop, the ES traded right up to where I said the stops were. Take note of the posts and times below from the Mr. Top Step chatroom:
IMPRO: Dboy :(9:36:29 AM) : stops from 4686.70- up to 4694-96 and again above 4698.70- up to 4710
IMPRO: Dboy :(9:36:51 AM) : gonna get ‘em
IMPRO: Dboy :(9:37:28 AM) : going to be a 30 to 40 handle up day
At 11:23 the ES traded up to 4704 and after some sideways back-and-fill, the ES traded up to 4709.75 — 1 tick off my stop-run high of 4710.
I want to point something out. No one is right every day, but I really believe MTS helps provide an edge for futures, options, and stock traders. I can’t boast of any top-secret indicators, nor do I get the heads up from Goldman.
What I provide is exactly what I did on the floor of the CME Group at my S&P desk: A feel for the markets. The customers — including the PitBull that used the desk — felt confident in what they were hearing or seeing. It’s called “market flow.”
After the high, the ES traded between 4700 and 4705 and printed 4798.50 as the 3:50 cash imbalance showed $1.98 billion to sell. It traded 4697.25 on the 4:00 cash close and settled at 4796.50 on the 5:00 futures close, up 15.5 points or +0.33% on the day.
In The End
In the end, it’s the same pattern time after time. The ES sells off and traders get bearish. Then the futures make a few higher lows, does some back-and-fill and goes back up. In terms of the ES’s overall tone, it was bumpy at the open, then firm all day. In terms of the ES’s overall trade, volume was LOW at 996,000 contracts traded. It seems the higher The ES goes, the lower the volume is.
Our View
It’s been a strong year for the stock market. As of yesterday’s close, the Dow is up 18% this year, the S&P 500 is up 25% and the Nasdaq has gained 24%. The rally has been supported by endless central bank support. Now that the government has racked up trillions of dollars in stimulus programs, the Fed is now getting ready to taper its bond purchases and is talking about raising rates. I think the taper is for sure. Raising rates? I am not sure about that. Even if they do, it’s months away.
Our Lean
The ES failed to take out its high and closed on the low ticks on the cash close. Many moons ago, the momentum traders would short the close. However, things have changed and that trade works less than 10% of the time.
I am maintaining my long ES position from 4673 and will add 10 to 20 points lower from my average if the ES reverses. According to the Ned Davis S&P cash study for the November options expiration, the Wednesday before expiration has been up 22 / down 15 of the last 37 occasions, while Thursday and Friday’s stats are up 23 / down 14 of the last 37. The Nasdaq stats are somewhat flat.
I have a feeling we could be in for some weakness today but I do not think it will last.
Here is Goldman’s revised 2022 year-end forecast:
We forecast the S&P 500 index will climb by 9% to 5100 at year-end 2022, reflecting a prospective total return of 10%, including dividends. Profit growth has accounted for the entire S&P 500 return in 2021 and will continue to drive gains in 2022. S&P 500 EPS will grow by 8% to $226 in 2022 and by 4% to $236 in 2023. Our EPS estimate is 2% above 2022 bottom-up consensus. Companies have consistently expanded profit margins despite input cost pressures and supply chain challenges. We expect profit margins will rise by another 40 bp to 12.6% in 2022 before declining by 20 bp in 2023 due to corporate tax reform.
As we all know, there’s no crystal ball when it comes to trading stocks, options, or futures. But the Market Imbalance Meter may be as close as it comes. Knowing how the “Big Money” is placing its bets can give our trading room a big wave to ride — or a warning sign to stay out of the water. Come check it out now, risk-free for 30 days.
Disclaimer: Charts and analyses are for discussion and education purposes only. I am not a financial advisor, do not give financial advice and am not recommending the buying or selling of any security.
Remember: Not all setups will trigger. Not all setups will be profitable. Not all setups should be taken. These are simply the setups that I have put together for years on my own and what I watch as part of my own “game plan” coming into each day. Good luck!
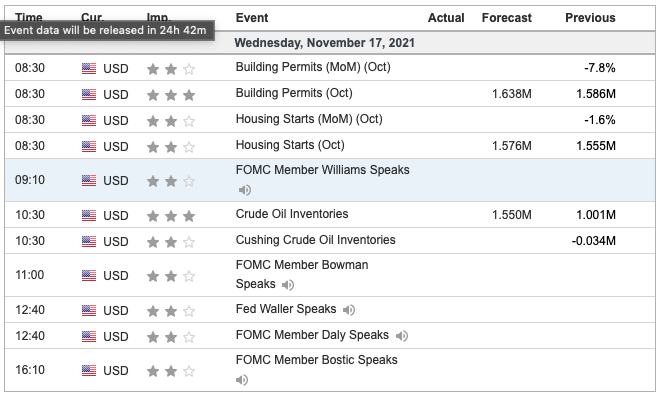
Economic Outlook
Comments are closed