Our View
I did not think the markets were going to respond well to Walmart’s warning, but we are seeing some interesting price action now that the S&P has been hit so hard.
The last time Walmart startled investors in May, the stock fell roughly 20% in a three-day span. That’s very un-Walmart-like as long-term investors in this name can vouch. Of course, it also came alongside disappointing results from Target, which triggered a wave of inflation/recession fear from investors.
This time we’re seeing a different reaction. The S&P is not plunging lower alongside Walmart. That’s even after MSFT and GOOGL reported a top- and bottom-line miss. Both stocks are higher this morning, along with the futures.
Does that mean the low is in? No! But you can’t deny that we’re seeing a change in tune. Now…onto the Fed.
Our Lean
Leading up to the last rate hike, the ES was selling off but eventually rallied after the June Fed meeting. While the ES has fallen 104 points since making its 4017 high, its selloff has really been tied to the weakness in the NQ/tech. But even the stocks with earnings misses — GOOGL & MSFT — are catching a bid.
I don’t like the markets and think they will eventually go lower but with the NQ already down 3 days in a row and the ES down 2 of the last 3 sessions with a flat day in between…I’m wondering if there is some type of rate-hike rally in store.
Our Lean: If the ES retests yesterday’s 3913 low, I think we could see a bounce. If the ES doesn’t hold, my key downside levels are 3909, 3901, 3870, and 3956. On the upside, my key levels are 3968 to 3970, 3978, 3988.50, 4006, and a ton of buy stops above 4017 up to the 4030 to 4040 zone.
My guts say there is a head-fake coming…
Daily Recap

The ES opened Tuesday’s regular session at 3952.75, upticked to 3955, and then sold off down to the 3938.50 level at 10:01. From there, it rallied back up to 3951.75, just a few ticks above the VWAP, and then dropped 10 points down to 3935.50 at 10:38. It rallied up to 3944 then dropped down to the 3917.50 level at 12:01. The ES short-covered up to the 3937.75 area at 1:12 and then eventually sold off down to a new low at 3913.25 at 3:10.
From there, the ES popped up to 3925.50 at 3:41 and traded 3916.75 at 3:49, and traded 3920.50 as the 3:50 cash imbalance showed $163 million to buy. The ES traded up to 3929 at 3:57 and traded 3925 on the 4:00 cash close. After 4:00, the ES rallied up to 3938, sold off down to 3915, and rallied back up to 3936…all within the span of 15 minutes! That’s as it sorted out the earnings misses from GOOGL and MSFT.
Eventually, the ES settled at 3939.25 on the 5:00 futures close, down 30.75 points on the day or 0.77% on the day.
In the end, I try to keep my feel for the markets in line with the news, which has not improved. In terms of the ES’s overall tone, the ES tried to rally a few times but again got dragged down by the Nasdaq futures. In terms of the ES’s overall trade, volume picked up late in the day but for the type of move it was low at 1.54 million contracts traded.
- Daily Range: 51.25 points
- H: 3964.50
- L: 3913.25
Technical Edge
- NYSE Breadth: 29% Upside Volume
- NASDAQ Breadth: 35% Upside Volume
- VIX: ~$24.50
Game Plan: S&P 500, SPY, Nasdaq, CNC
Today’s the Fed. Traders need to remember that the market tends to get very choppy after the first hour of trading as we await the 2pm announcement. From there, it’s an algo’s paradise as the machines run the stops in both directions.
S&P 500 — ES

Tuesday resulted in an inside-and-down rotation, which put our key 3920 area to the test. This level was cracked but not broken, as the ES made a low around 3913 but closed at 3923.
In effect, the 10-day, 50-day, and daily VWAP measures held as support.
If we get a daily-up rotation from here by clearing 3965, that could open the door back up to 4000.
On the downside, a bearish reaction to the Fed could put the 3870 zone in play — the 21-day and the 50% retrace of the current range.
A Trade on the S&P 500 Futures

Interestingly, yesterday’s trade did not come to fruition, but it’s an option today. I’m keeping a close eye on the 3965 to 3968 area. Off the open I’ll be watching this zone and looking to sell the initial rallies to this area if it remains resistance.
If it pushes through this zone, then we have a daily-up rotation, which could put 3975 in play, followed by 3989.
S&P 500 — SPY

Bulls need to hold the $390 level. That’s very clear. A break below this zone could put $385 in play.
On the upside, $400 to $401.50 is resistance. Above it puts $408 to $410 in play.
Nasdaq — NQ

Nice pop overnight on the NQ, as GOOGL and MSFT rally. 12,325 to 12,335 has been resistance on Tuesday and overnight. Keep an eye on this area today.
Above is bullish, but it’s resistance until proven otherwise.
CNC
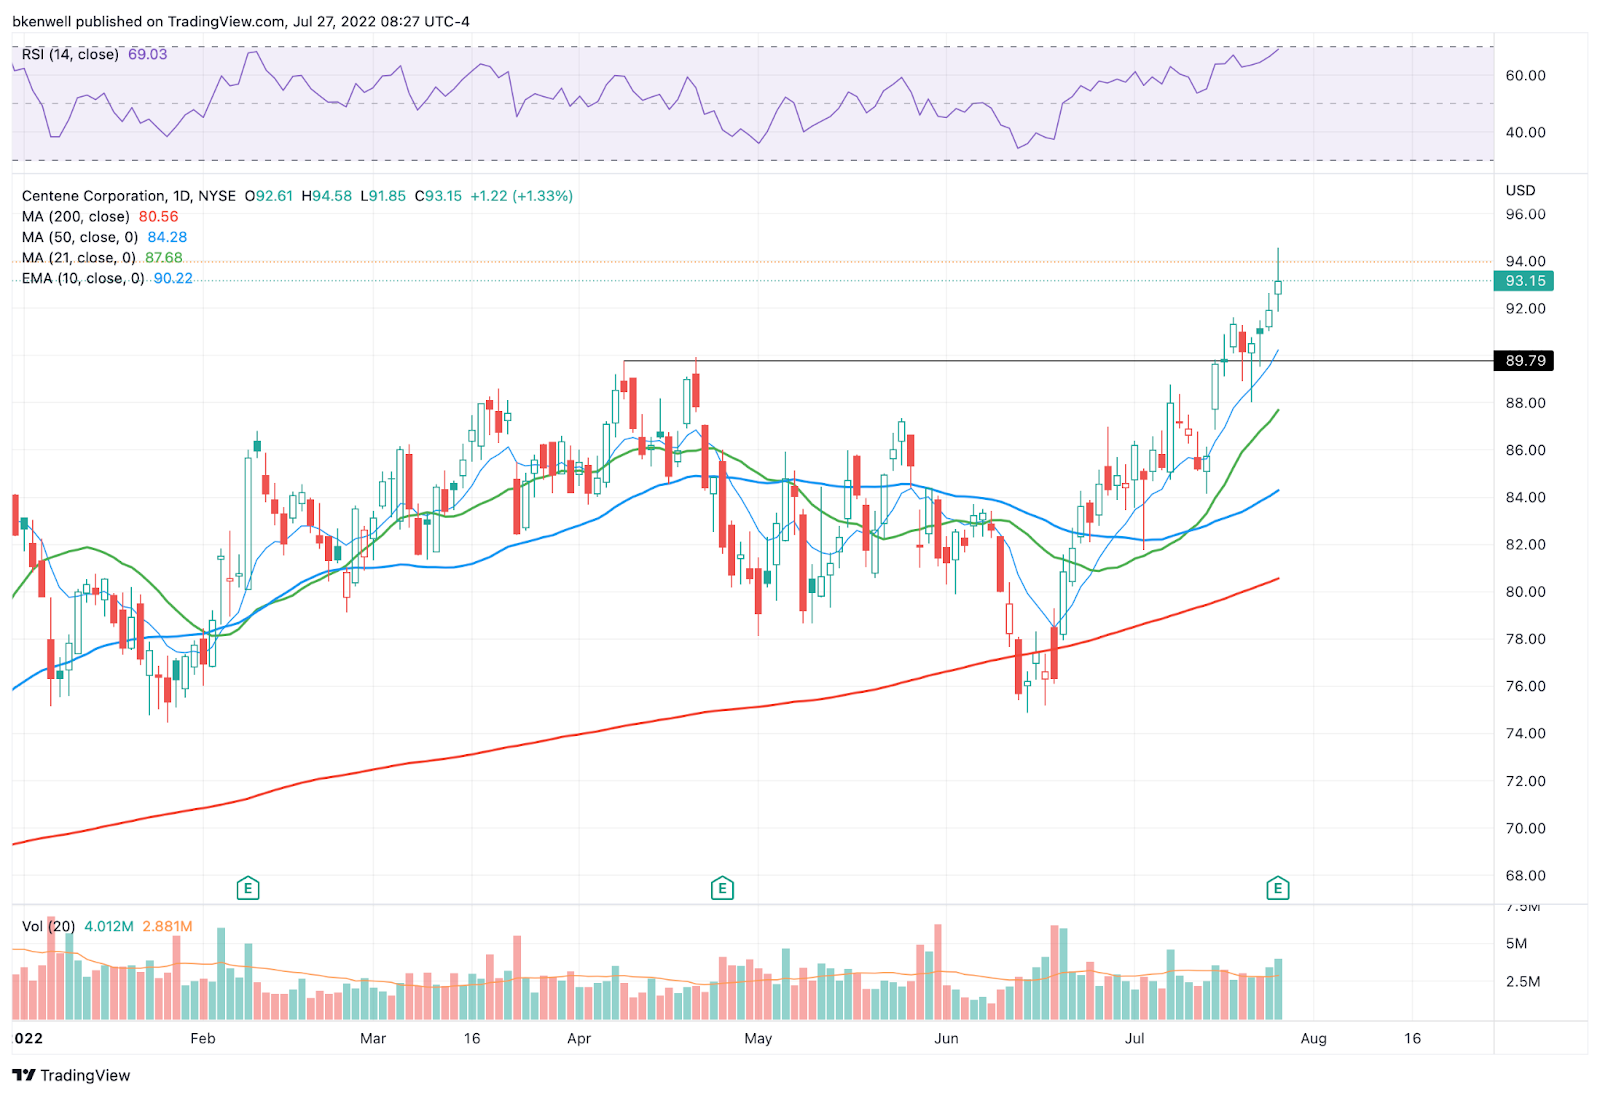
Keep an eye on an eventual pullback to the $89 to $90 area.
Go-To Watchlist — Individual Stocks
*Feel free to build your own trades off these relative strength leaders*
- Numbered are the ones I’m watching most closely.
- Bold are the trades with recent updates.
- Italics show means the trade is closed.
Trade Sheets: Down to 1 individual holdings against a profitable stop-loss.
- MCK — We have hit two trim zones so far on MCK. Feel free to cash the last ⅓ of the position as you see fit. $335 to $340 is a potential upside target (and has since been hit).
- Moving stop-loss up to $315 and given the consolidation, I am thinking of holding my last ⅓ for a push to $348 to $350.
- PEP — Noted the bull flag earlier this week and noted the weekly-up over $171.25 on the list below. Triggered yesterday off KO’s earnings response.
- From here, I want to trim a little at $173 to $173.50, just to put some money in my pocket. From there, I’m really looking for $176 to $177. On the downside, I’m using $168 as my initial stop-loss.
- COST — I ended up taking a ½ size position at the gap-fill ($513.25). I am going to use a stop-loss of $505. I may consider making it a full-sized position if we go daily-up over $519.68.
- On the upside, I’d like to see $525 to $526.
Relative strength leaders (List is cleaned up and shorter!) →
- O
- CNC
- HRB
- CHNG
- COST
- PEP — weekly up $171.25
- BA — beauty
- ABBV
- UNH
- XLE
- VRTX — really nice action lately.
- MCK — trying to break out.
Economic Calendar
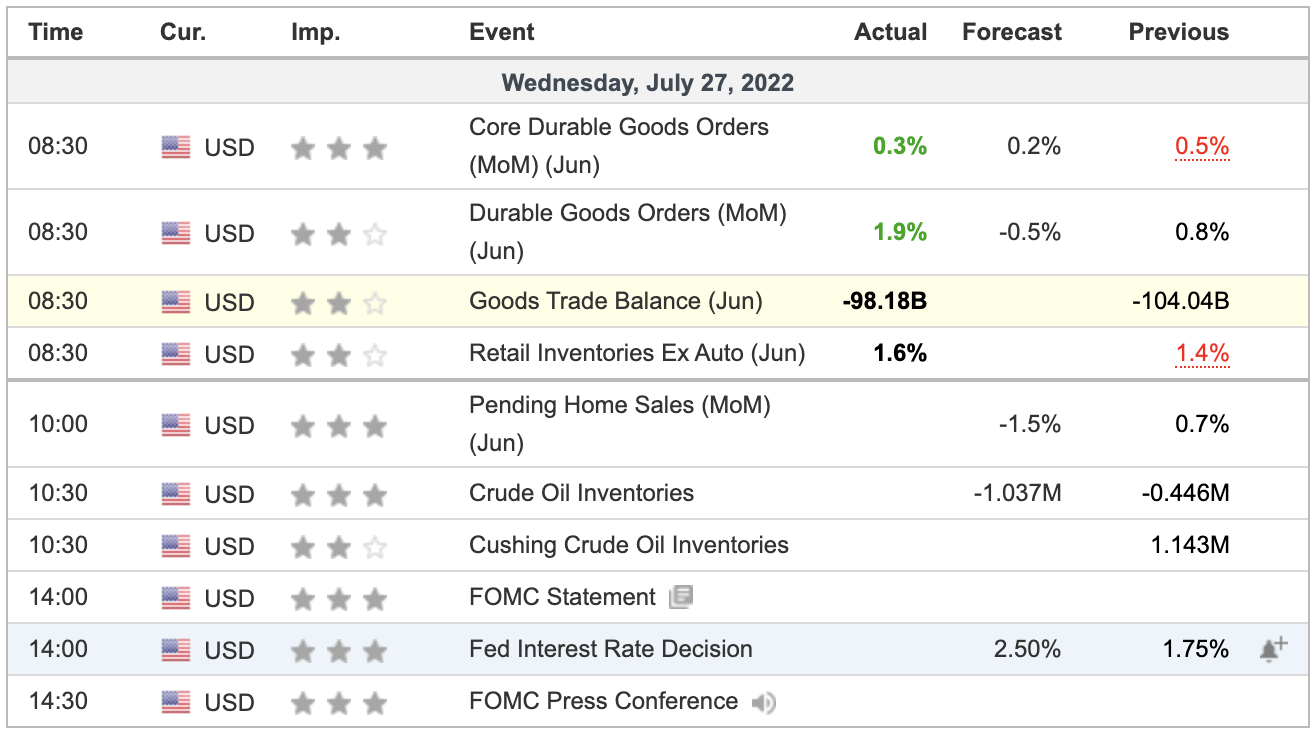
As we all know, there’s no crystal ball when it comes to trading stocks, options, or futures. But the Market Imbalance Meter may be as close as it comes. Knowing how the “Big Money” is placing its bets can give our trading room a big wave to ride — or a warning sign to stay out of the water. Come check it out now, risk-free for 30 days.
Comments are closed