Our View
The ES is down 16% and having its worst start to a year since 1970, but it’s not the only thing falling. Bonds and gold — two typical safe havens — have fallen sharply. A 14-year rally amid the “easy money” monetary policy is coming to an abrupt end as investors are in a “sell everything” mentality.
There is a lot of talk about the US economy entering a recession and unfortunately, I think the odds favor it. So does Goldman Sachs senior chairman Lloyd Blankfein. He said companies and consumers should prepare for a US recession, saying it’s a “very, very high risk.”
Over the weekend India, the second-largest producer of wheat, banned exports amid food-supply concerns, as wheat prices have increased over 40% since the beginning of 2022. I for one think this is a very bad omen for what’s to come. My question to you is, are you concerned?
The public is scared, but they are not dumping their stock investments.
According to Bank of America, for every $100 inflow, there were $113 in outflows during the credit crisis. During the Covid-19 decline of 2020, investors pulled $61 for every $100 invested and so far during “the great unwind,” for every $100 in inflows at the start of 2021, there have been only $4 in outflows.
Further, according to the American Association of Individual Investors (AAII) late last month, some 59% of individual investors said they expected stocks to fall over the next six months, the most bearish sentiment since the financial crisis. That same month, however, stocks made up about 70% of their portfolios, hovering around the highest levels since 2018.
So they say one thing — they’re bearish — but are doing another by staying long. Only time will tell if they are being foolish or smart.
Our Lean
I think the ES can rally further but I also think it’s important to not get overly “bulled up.”
If the ES gaps higher, our lean is to sell the open or the first rally above the open and buy the pullbacks — keeping in mind the size of the ranges. If the ES opens lower, our lean is to buy the weakness for the first part of the day.
Is the low in? No. Can the ES have a short-covering rally? Yes, it’s just how far it can go and how long it will last. The specific levels can be found below.
Daily Recap
The ES opened Friday’s regular session at 3970.75, fell 11 points down to Thursday’s high of 3961.75, undercut it by a couple of points, and ricocheted higher. It rallied 60 points in less than an hour, pulled back 22 handles and bottomed at 3997, and then plowed higher by nearly 40 handles, peaking at 4036 at 12:10 — the session high.
Even though it was a 90%+ upside day, the bulls were not in control for all of it. The ES chopped lower off the high, then really took a tumble, coughing up 60 points and falling to 3975 at 2:00. From there, it rallied ~54 points to 4028 at 3:20 and went into the 3:50 cash imbalance at 4016. The MIM showed $662 million for sale, the ES traded 4002.50 at 3:53 and traded 4020.50 on the 4:00 cash close. It settled at 4014 on the 5:00 futures close, up 86.75 points or +2.21% on the day.
In the end, the ES shook off the early week selling to rally 181 points from Thursday’s low to Friday’s high. In terms of the ES’s overall tone, it was firm — with the exception of the midday drop — and every dip was bought. In terms of the ESs overall trade, volume was lower at 1.86 million contracts traded.
- Total Range: 120.5 points
- H: 4036
- L: 3915.50
Technical Edge
- NYSE Breadth: 92% Upside Volume (!!)
- NASDAQ Breadth: 89% Upside Volume (!)
- VIX: ~$29.50
On Friday we wrote: “You can feel the market’s “urge to surge” and tear up those who have flipped from long to short and gotten too far offsides with the short trade. Could we be looking at some type of dead-cat bounce?”
That’s exactly what we got. Now the question becomes, how much relief will this rally provide?
Game Plan — S&P (ES and SPY), Nasdaq (NQ and QQQ), Individual Stocks
Despite Friday’s rebound, the S&P still finished lower for the week. In total, it’s now down in six straight weeks.
Bulls are due a bounce, I’m just not sure how long this one will last. At least we came into Friday bullish, so that got us in a great position. Not only were we bullish, but we avoided the pain of being short.
S&P 500
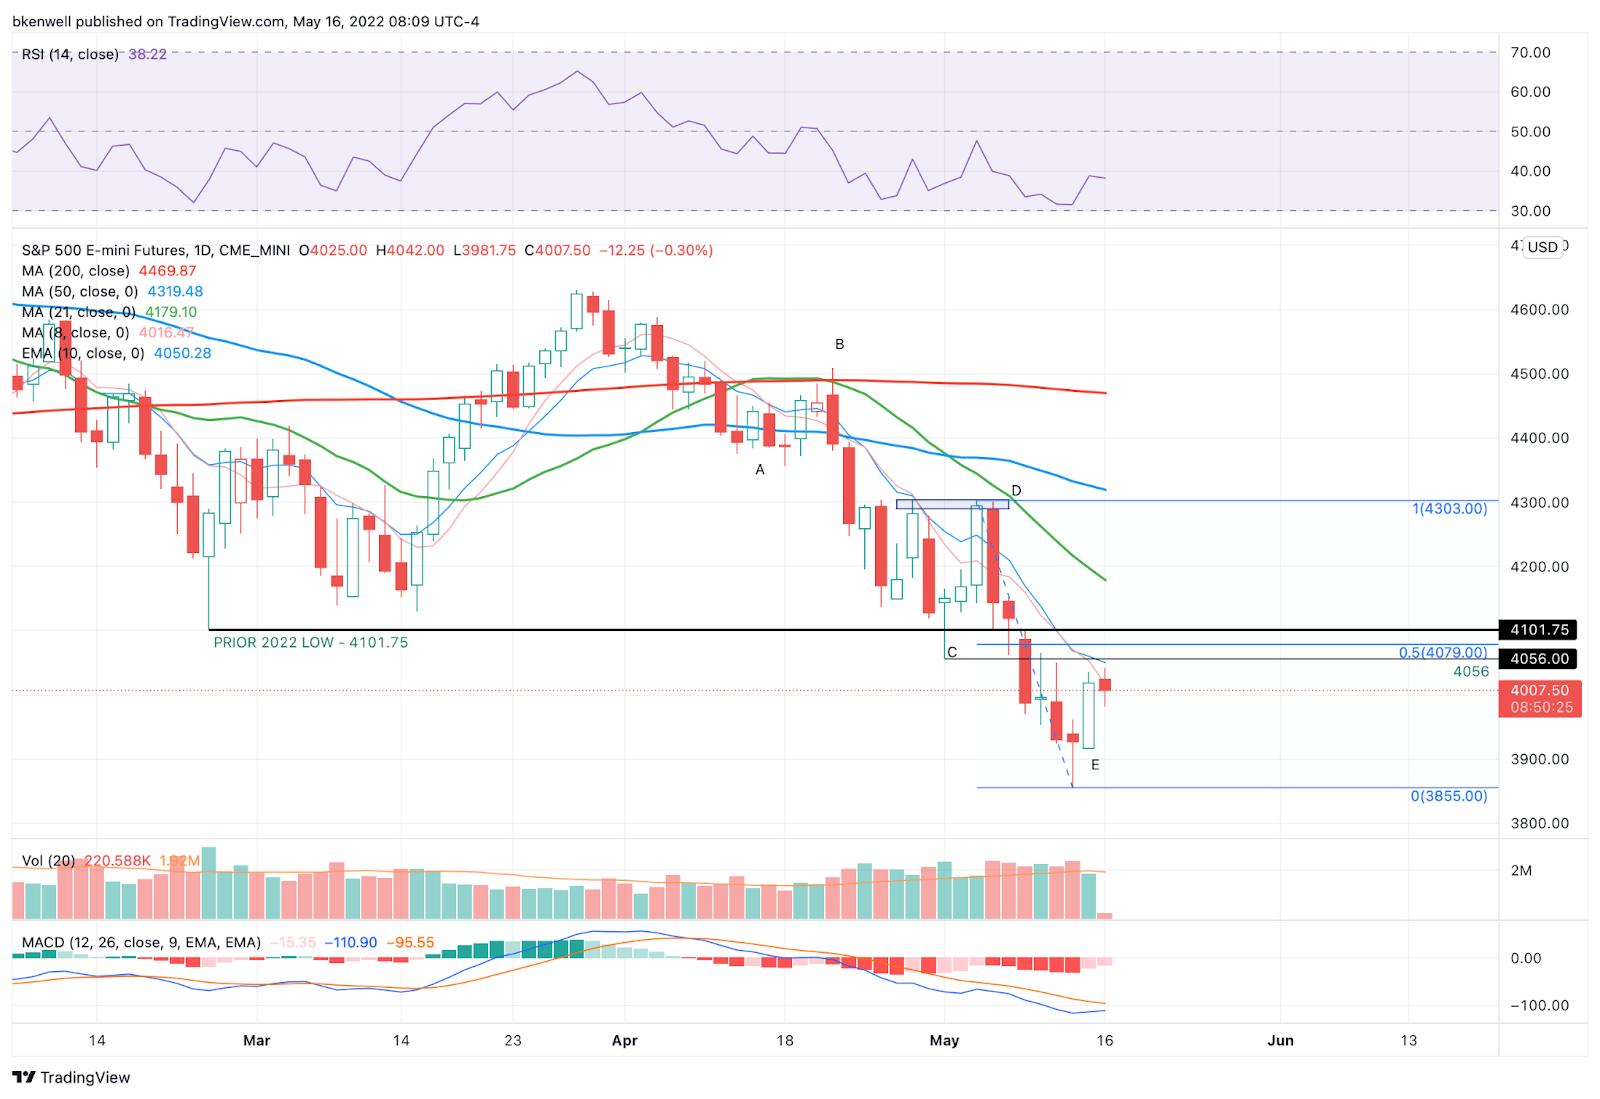
As highlighted on Friday, each leg of this downtrend has provided a rally back to the 50% retracement. If we can do that again, it puts 4080 on the table.
On the upside, the roadmap is pretty clear. Friday’s high is the first hurdle at 4036, followed by the Globex high at 4042. Clear this six-point range and you’re looking at the 10-day at 4050 and that key 4056 level.
Above all of that puts our 4080 level in play, followed by the significant 4100 level, which was the prior 2022 low until this month.
On the downside, watch 3975. If this area holds, bulls can stay in control. Below and things become “more iffy.” A break below it and failure to reclaim could put 3925 to 3930 on the table.
SPY
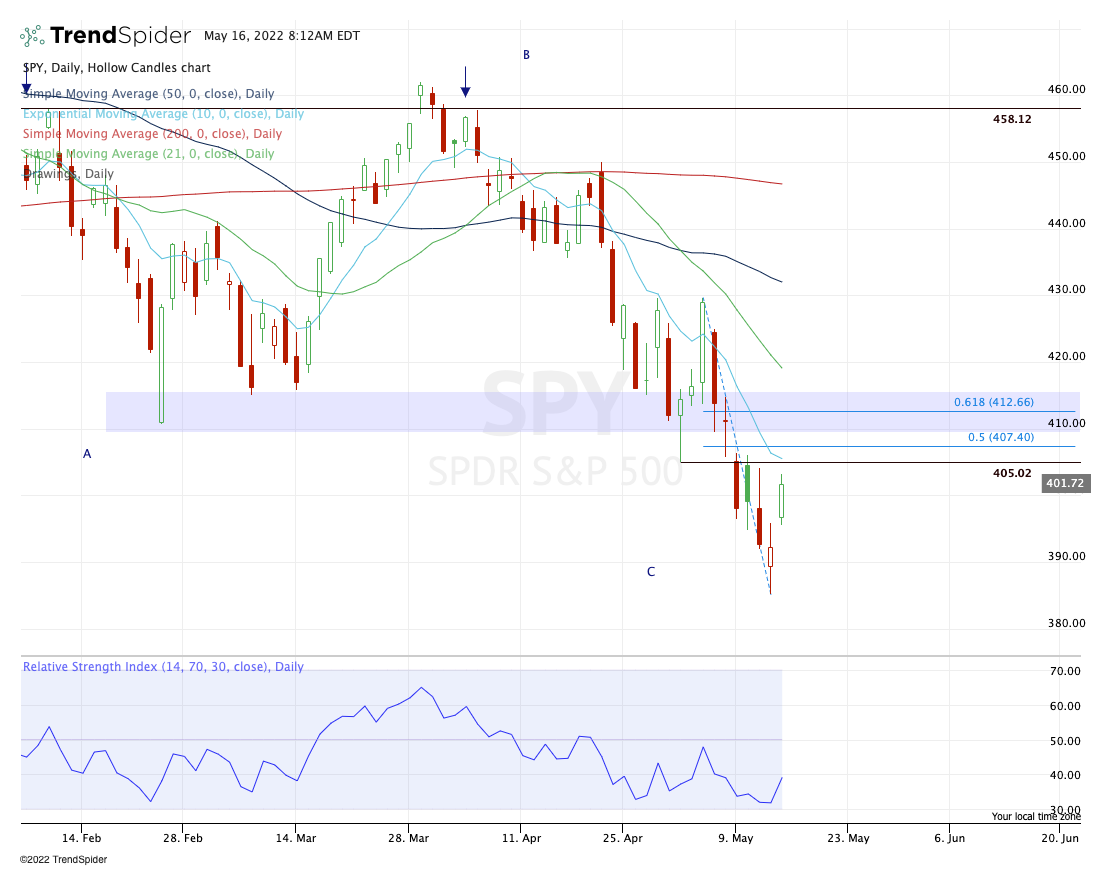
Like the ES, the SPY needs to clear Friday’s high at $403.18. A break above that and an ability to hold above it opens the door to $405, which was support two weeks ago but resistance last week.
Above that and we can test into the $407.50 area, followed by $410 to $414.
If we lose Friday’s low at $395.61, then things look a lot iffier.
Nasdaq

On Friday we had a test of the 10-day, the NQ’s first in 7 sessions. If we can go daily-up over Friday’s high and the 10-day, it quickly puts the 50% retrace in play at 12,618 — 100 points above this stubborn 12,520 area.
Clear that and a scenario exists where we see 12,800 to 12,850 — this was support in late April and early May, in addition to being the 61.8%. That’s followed by the 21-day.
On the downside, keep an eye on 12,100. Losing this level gets me more cautious and has me watching the 11,950 to 12K area.
QQQ

The QQQ is not quite as far along as the NQ in terms of the technicals. If we get a daily-up over $303, we have a test of the $305 area and the declining 10-day on tap.
Above that puts $310 in play, then $313 (the 50% retrace), then $317 to $318 (breakdown spot, 61.8% retrace and declining 21-day).
On the downside, below Friday’s low of $294 kills this rally.
ARKK

ARKK has been a total dumpster fire. However, if it can go weekly-up over $45, it could open the door for another serious push, potentially up to $55.
I’m not saying it’s likely, but this name has been decimated and a big dead-cat bounce could be in store. Given last week’s close, weekly-up could give us a low-risk rotation trade and potentially put former support and the declining 10-week in play.
PANW

PANW was one of our lone relative strength tech stocks throughout 2022 before it imploded over the last few weeks.
However, last week we saw a robust rally off the lows.
If it can go weekly-up over $500 and this week’s low is reasonable — it’s currently trading ~$492 in the pre-market — then we could have a nice snap-back rally if tech can continue to power higher.
It could put the $540 to $550 area back in play. We’ll see.
XOM

If XOM can go daily-up over ~$89 and hold above it, then $91 to $91.50 could be in play.
This is a quick “single-hit” type of trade and I would use a smaller size if pursuing it.
Go-To Watchlist
*Feel free to build your own trades off these relative strength leaders*
Numbered are the ones I’m watching most closely. Bold are the trades with recent updates.
- AR — Was looking for $35 on First Target. Hit $34.90. Anything above $34 was good for a trim. → Now B/E stop-loss on this one.
- ABBV — Weekly up → $148.75 seems like a reasonable stop-loss level. $150 for more conservative traders. On the upside, I’d love $160 to $162 as our first trim. More conservative traders can trim at $157.
Relative strength leaders (List is cleaned up and shorter!) →
- AR
- WMT
- PEP
- KO
- MCK
- BMY
- JNJ
- DLTR
- DOW
Economic Calendar

As we all know, there’s no crystal ball when it comes to trading stocks, options, or futures. But the Market Imbalance Meter may be as close as it comes. Knowing how the “Big Money” is placing its bets can give our trading room a big wave to ride — or a warning sign to stay out of the water. Come check it out now, risk-free for 30 days.
Comments are closed