Our View
We’re coming into a new year. That’s a clean slate and a fresh start. Whatever bad trades, bad tastes and negativity you are carrying from the 2021 trading year, it can be left in last year as far as I’m concerned.
In fact, I want to do something fun here.
On Friday, I laid out my six predictions for this year. Check them out if you missed those.
For Monday — the first trading day of the year — let’s take things slow. We don’t need to force anything dumb here and start off the year on the wrong foot.
Our Lean
Last week we had a push to new all-time highs on Monday, then the ES slowly eroded throughout the week. The ES is higher to start 2022, rallying to a Globex high of ~4791.
If we do pull back, I want to see how it handles the upper 4770s. That was the double-top high from Friday. If we do dip this far and the ES finds this area as support, then we may have a buying opportunity.
On the upside, keep an eye on the 4797 to 4800 area. That was resistance on Tuesday and Thursday last week. A push above 4800 could start triggering the buy-stops.
Daily Recap
There’s no reason to get tripped up over the last trading session of 2021. Of course, we will recap it, but we’ll keep it short because the trading volume was low and the market lacked follow-through in both directions.
After falling 0.25% on Thursday, the ES had a quick 20-handle roundtrip dip and rip when the Globex session opened, then settled into a trading range that lasted through Friday’s regular session.
The ES opened in the middle of that range, at 4766.25, and quickly rallied to 4778.50. That became the session high, as the ES pulled back from that high just as fast as it had rallied there.
From the overnight session, all the way through to the close on Friday, each dip down to the high 4750s was met by buyers. However, each rally into the 4770s was met by sellers. The ES did gain some upside momentum later in the day, but that rally couldn’t last either.
That’s as the ES rallied to a high 4778.25 just after 3:45 — one tick shy of the session high — then reversed hard down to the regular-session low at 4757.25.
The ES went on to close at 4759.50 at the 4:00 cash close and settle at 4761.50 at the 5:00 futures close, down 11 points or 0.23%
In the End
In the end, it was a semi-directionless, low volume struggle. It was like half of the traders opted for a holiday instead of trading — and that’s exactly what happened!
In terms of the ES’s overall tone, it was mixed most of the day. In terms of the ES’s overall trade, volume was higher than Thursday, but still low at 954,000 total contracts traded.
As we all know, there’s no crystal ball when it comes to trading stocks, options, or futures. But the Market Imbalance Meter may be as close as it comes. Knowing how the “Big Money” is placing its bets can give our trading room a big wave to ride — or a warning sign to stay out of the water. Come check it out now, risk-free for 30 days.
Technical Breakdown
- NYSE Breadth: 45.5% upside volume
- NASDAQ Breadth: 33.5% upside volume
Friday was nothing special. In fact, most of last week was not very special (short of Monday).
In years past, I always struggled with knowing when to take my foot off the gas. I think we did a really good job last month of using the brake and the gas when each was necessary.
I’m hopeful that we can continue to do that going forward too! It saves our trading capital and more importantly, lets us replenish the mental capital as well.
As we shift into a new year, we have an opportunity to wipe out last year’s poor trades. The key is learning from those poor trades so we don’t make the same mistakes we did last year.
Game Plan
We have a decent pre-market push on Monday morning, with the S&P futures, SPY, and QQQ all up about 60 basis points. How the market manages that gap-up may say a lot about this week.
In an ideal world, they’ll sell the open with a mild dip and give bulls a chance to get long before pushing higher. However, the market could give a damn about “an ideal world.”
We’ll see what it wants to do after the open and go from there.
S&P 500 — SPY

On Friday we traded the SPY with a 4-hour chart and had a great dip-buying opportunity as a result.
I would love a dip down to the 10-day and the prior breakout area near $472 to $473.50. However, depending on how Monday’s gap is handled, we may not see a test of this area until later this week — if it’s tested at all.
In this scenario, we should at least see a bounce and it would have me on watch for a buying opportunity. On the upside, let’s see how the SPY handles the $478.50 to $479 area.
Above that and perhaps we can see some continuation higher.
QQQ
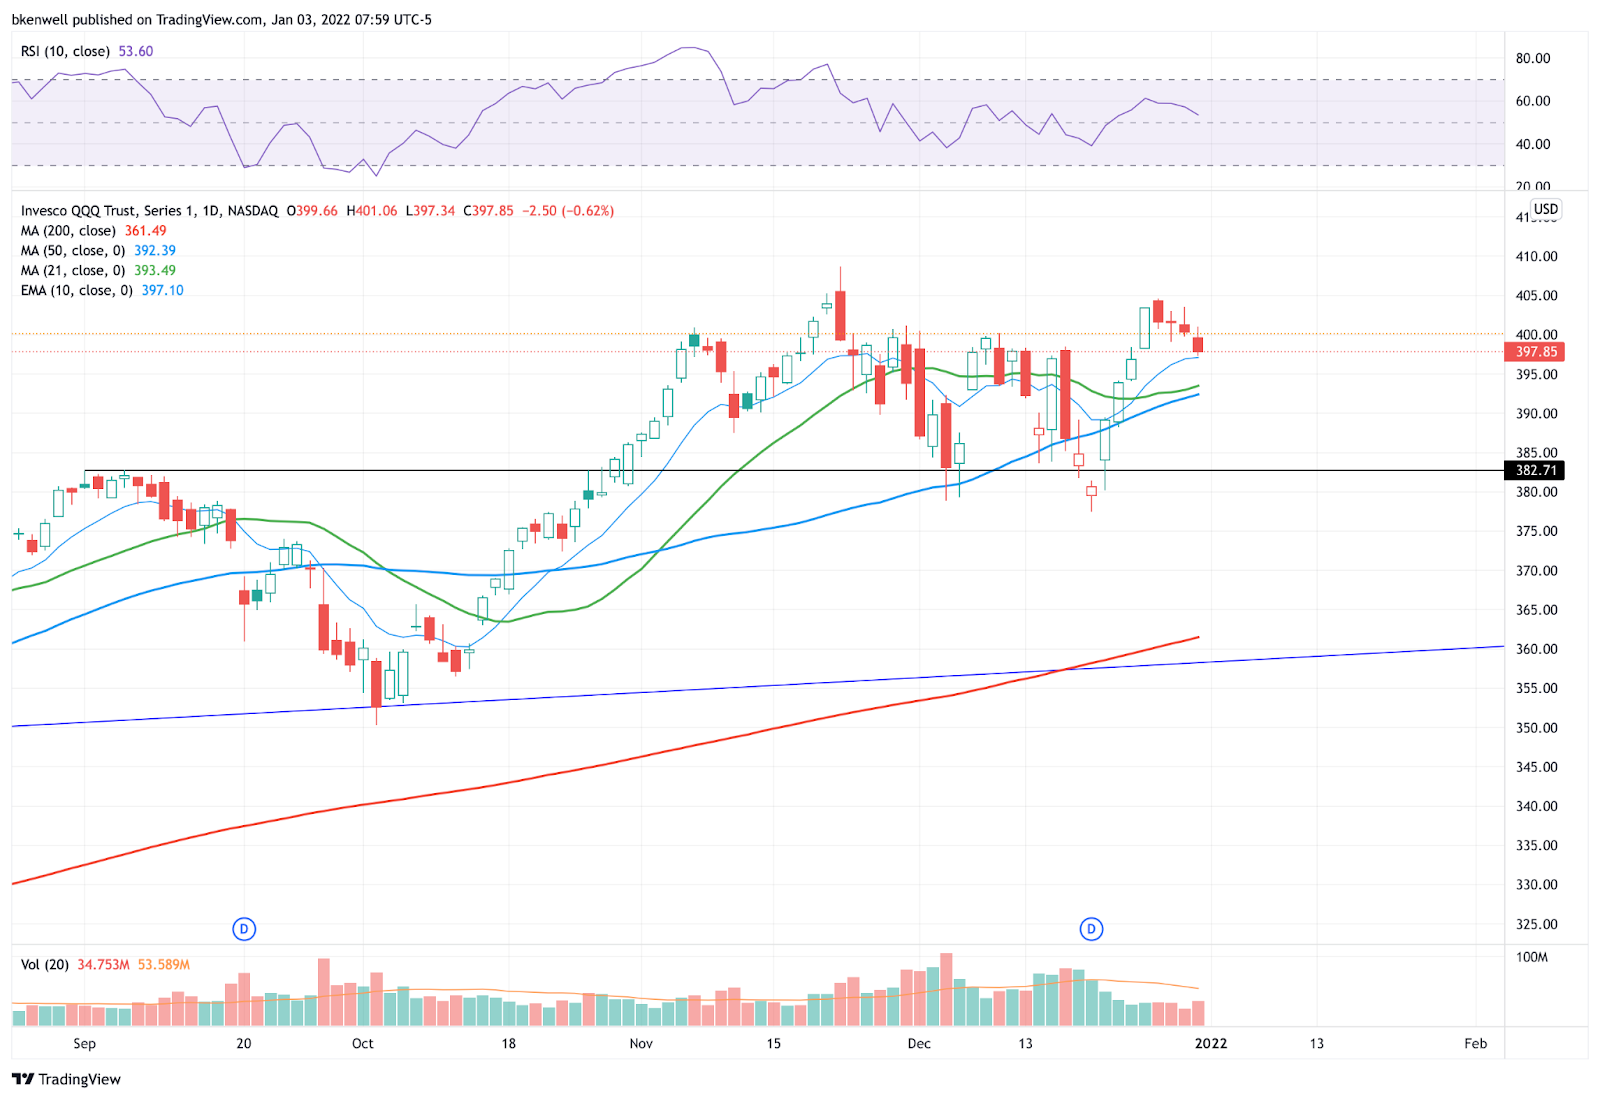
As for the QQQ, we had that explosive rally met by four straight down days. That’s not a common occurrence for the QQQ and we’ve got it in combination with a reset test of the 10-day and the prior resistance area.
Gapping higher now, let’s see if the QQQ can go daily-up over $401.06. If it can, last week’s high becomes the next upside objective near $404.50.
On the downside, I don’t want to see the QQQ lose Friday’s low.
Individual Stocks — PYPL, TSLA, COST
Let’s look at a few names, ranging from daily to monthly setups.
TSLA

TSLA is ripping higher on Monday, up more than 7% in pre-market trading. If it opens this way, Tesla will go weekly-up at the open, over $1,119. That will also put Tesla stock in a breakout over channel resistance.
The key here will be holding these gains.
If it can stay above $1,119, then bulls will be looking at the monthly-up level at $1,173, followed by $1,200-plus.
Below $1,100 and investors need to be careful about a retest of the 50-day.
PayPal
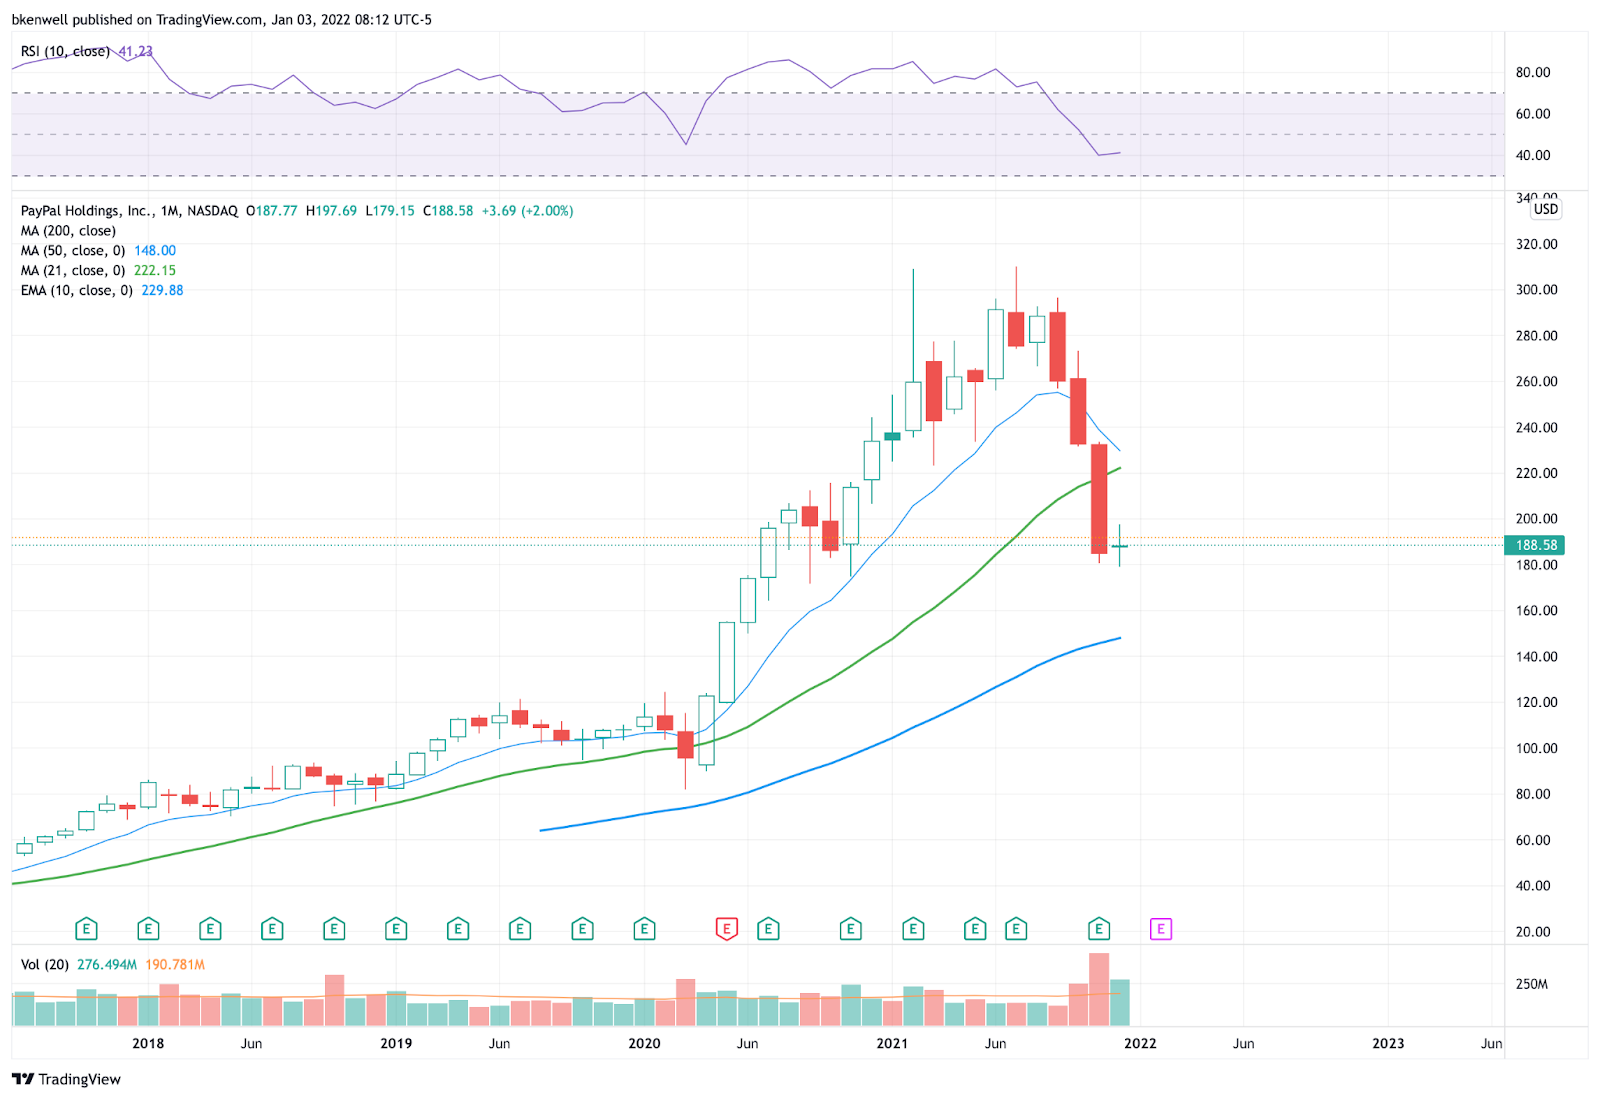
PayPal stock has been crushed, falling 36% over the past three months. However, last month it gave us a tight doji candle to work with.
If we get a monthly-up rotation over ~$198, it may be worth paying attention. This is one to set an alert on in January and be patient. If it doesn’t fire, that’s okay.
If PayPal goes monthly down, $175 could be on the table.
Costco

Costco continues to trade incredibly well. I know we’ve talked about this one a few times but look at the way it bounced on Friday on a tag of the 10-day and in conjunction with prior resistance near $560.
Weekly-up over $571.50 could put the 161.8% extension in play. Keep in mind though, we should get Costco’s monthly sales numbers later this week (Wednesday, I believe).
AVGO

With AVGO dipping to the 8-day, a bounce could put last week’s high in play.
However, I would love a further dip down to the 10-day.
ZTS
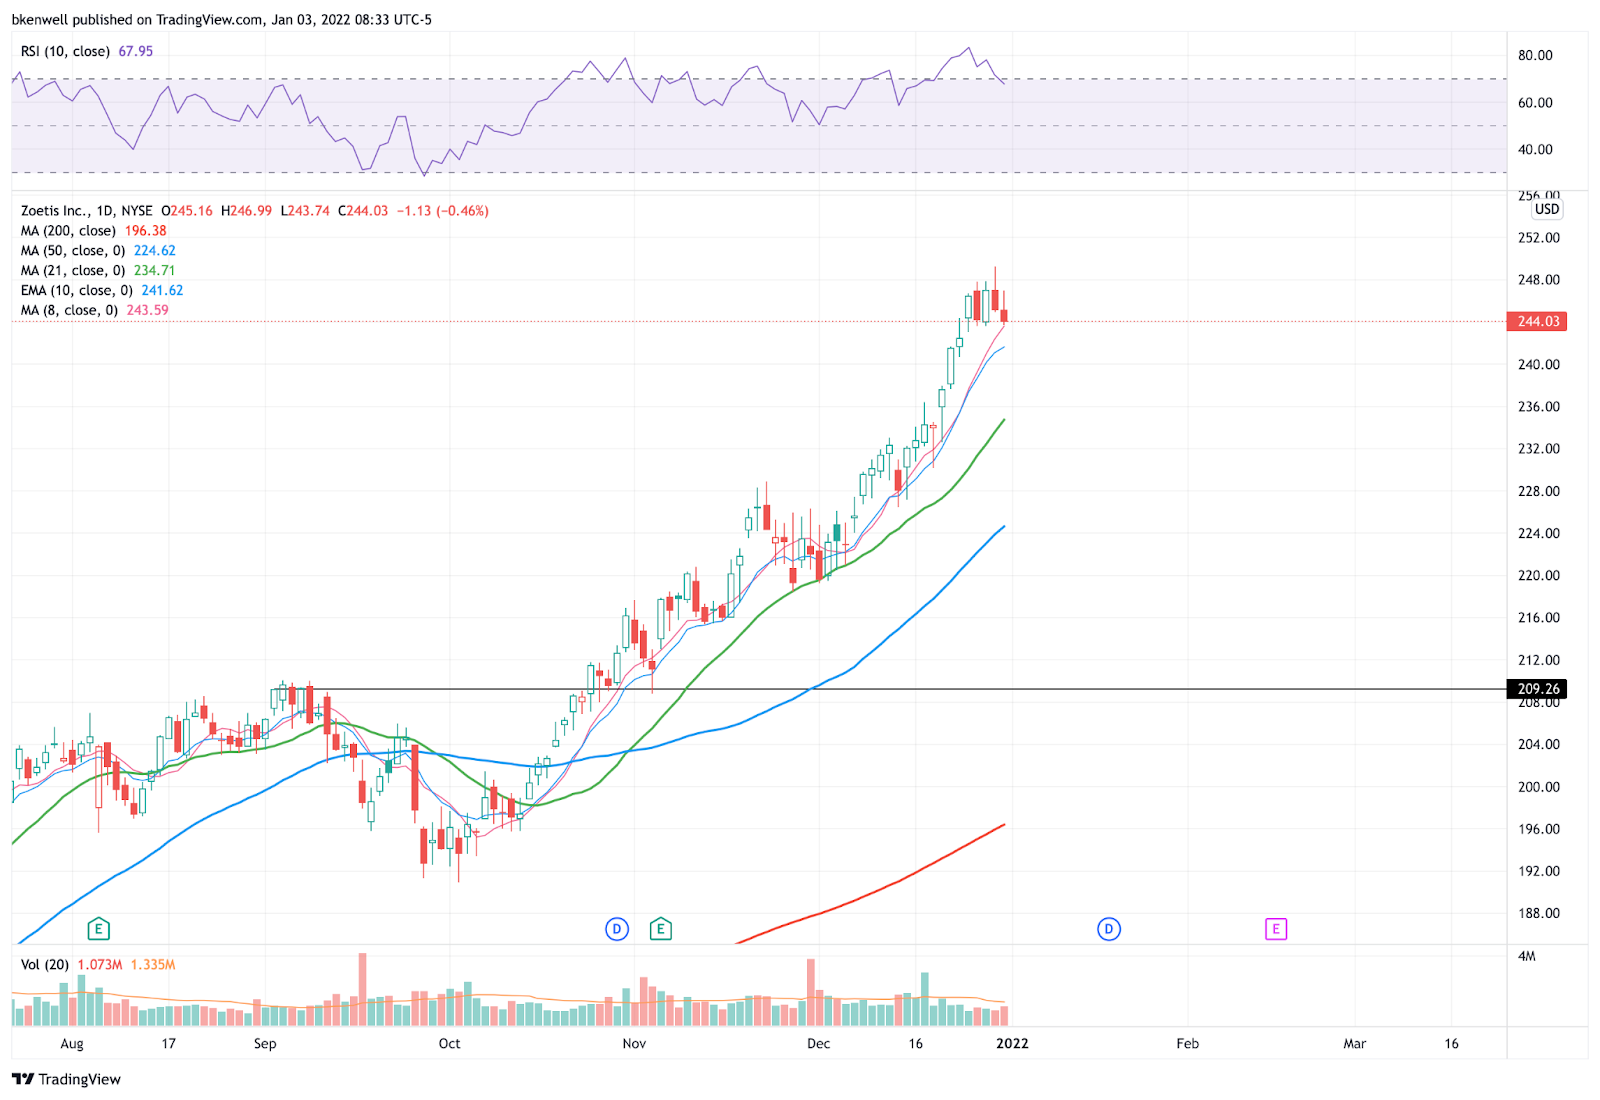
Same with Zoetis…
…And Cisco

Disclaimer: Charts and analyses are for discussion and education purposes only. I am not a financial advisor, do not give financial advice and am not recommending the buying or selling of any security.
Remember: Not all setups will trigger. Not all setups will be profitable. Not all setups should be taken. These are simply the setups that I have put together for years on my own and what I watch as part of my own “game plan” coming into each day. Good luck!
Economic Outlook

<Enter Sign Up>
Comments are closed