Updates on ES, NQ, SPY, and QQQ.
Follow @MrTopStep and @BretKenwell on Twitter and please share if you find our work valuable.
Our View
Yesterday’s action wasn’t a complete surprise, given some of the historical action of post-MLK Day action.
However, the big story of the day was that Goldman Sachs’ profit tumbled 66% to $1.33 billion in the fourth quarter, well below what Wall Street had expected. Morgan Stanley’s earnings fell 40% to $2.2 billion, barely beating analysts’ expectations.
Goldman’s 6.5% tumble weighed on the Dow, which fell more than 1% on the day, while the rest of the indices were near flat.
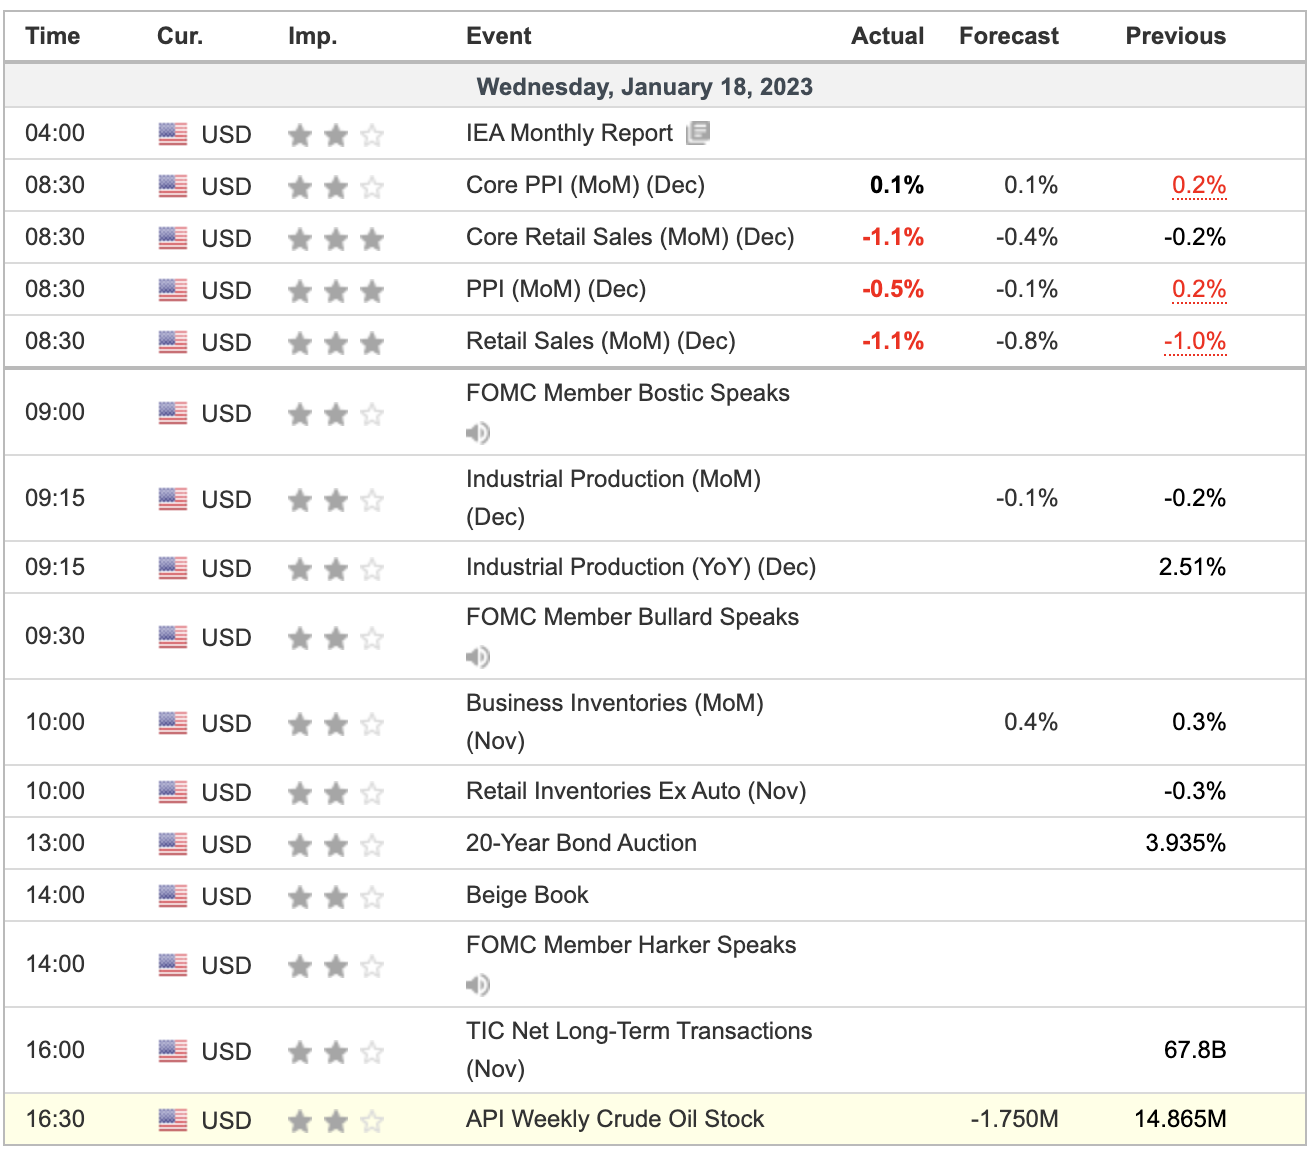
As for today, we have the PPI report and retail sales report due up at 8:30 a.m. ET (results below). On the earnings front, nothing particular stands out until tomorrow (when we get PG, NFLX).
Our Lean — Update on CPI
The weakness in the Dow and YM pretty much overshadowed the ES and NQ — even though the latter two both closed higher.
Our Lean: I’m doing my best to scale things down in this current environment. With that, I’m keeping my approach brutally simple, which is to sell the early rallies and buy the pullbacks, especially if the ES gaps higher.
The ES can’t get going unless it can clear and hold above the 4025 to 4030 area. On the downside, 3996 to 4000 has been support. If that fails, 3965 to 4970 is the next area of support on my charts.
MiM and Daily Recap

The ES sold off down to 4000.50 and opened Tuesday’s regular session at 4018.75. After the open, the ES up ticked to 4023.50 and sold off down to 4009 and then proceeded to grind its way up to 4035.25 at 10:24. It then traded down to 4002.75 at 11:25 and rallied up to a lower high at 4019 at 12:07, pulled back down to 4007.25 at 12:28 and then rallied back up to 4021.25 at 2:16, fell 13 points, then rebounded 11 points.
That setup a grind lower into the 3:50 imbalance reading, which showed more than $1 billion for sale. The ES traded down to 4004 but then traded 4010 at the 4:00 cash flow. At 5:00, the ES settled at 4009, down about 9 points or 0.22% on the day.
In the end, there was a massive rotation out of the Dow and into the Nasdaq. In terms of the ES’s overall tone, it was firm when the NQ was up-ticking and weak when it wasn’t. In terms of the ES’s overall trade, volume was higher than we thought it would be at 1.37 million contracts traded, but still low given the ranges lately.
Technical Edge
- NYSE Breadth: 51% Upside Volume
- Advance/Decline: 61% Advance
- VIX: ~$19
For what it’s worth, I still like Ulta’s setup from Friday. And keep an eye on CAT.
S&P 500 — ES
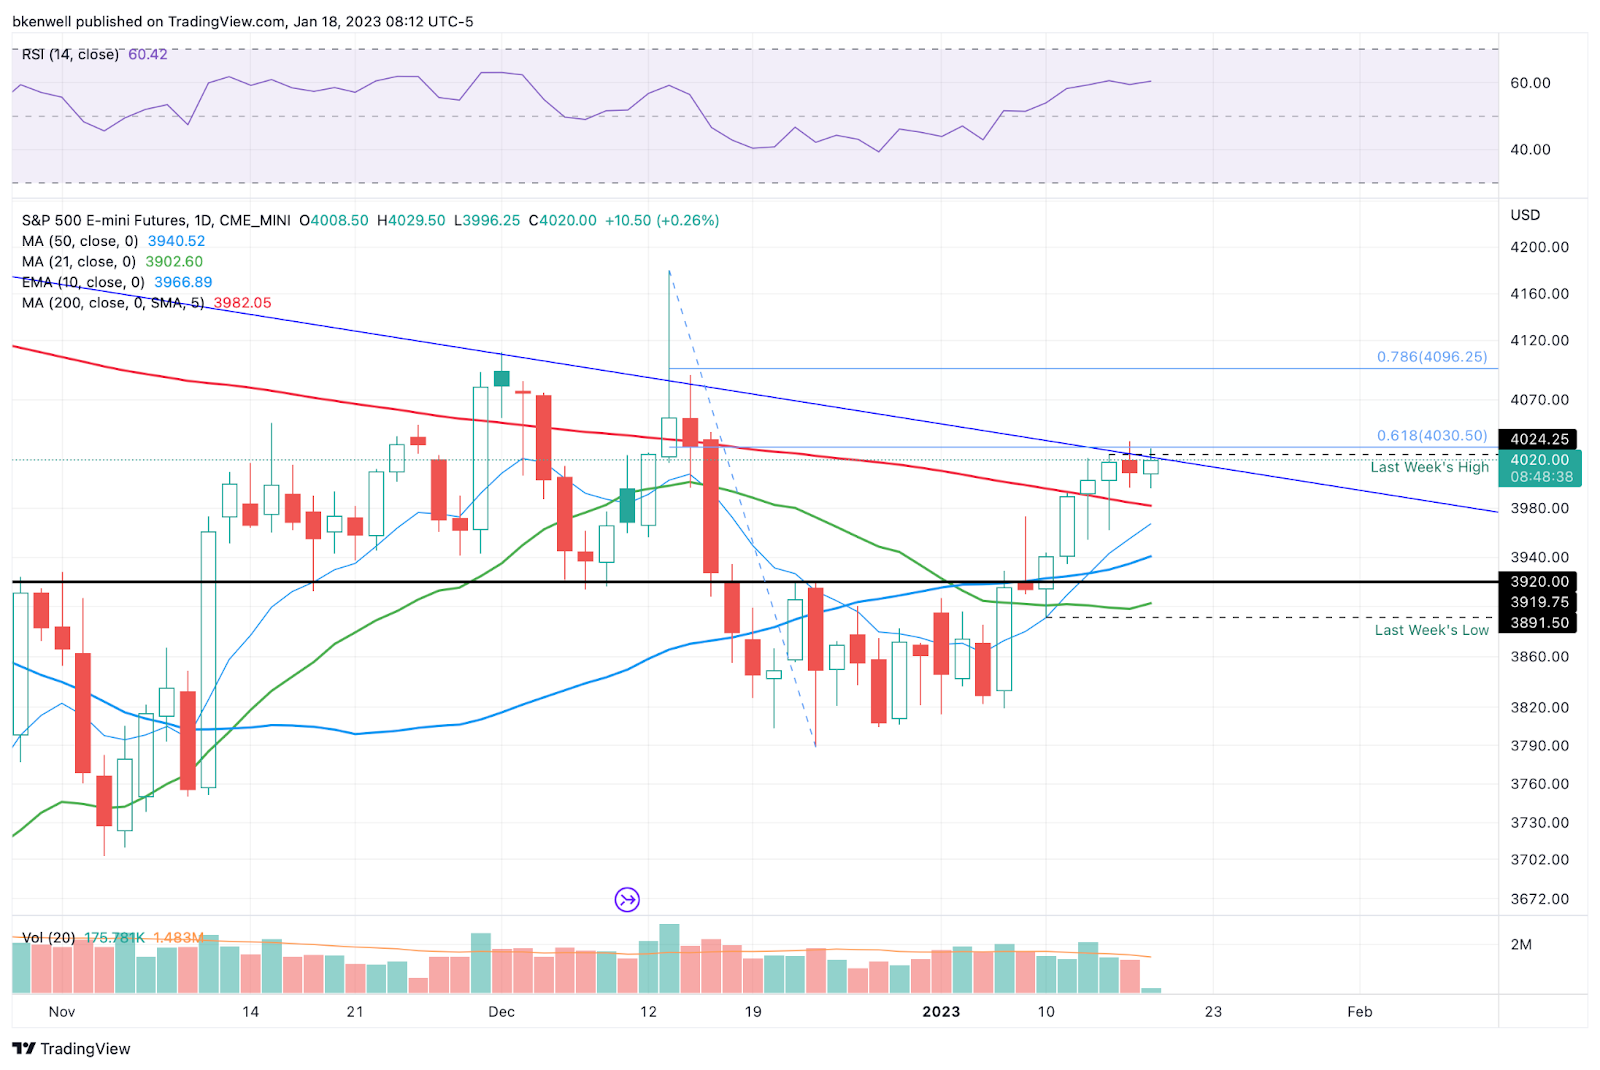
The ES remains trapped below last week’s high and its long-term downtrend resistance mark. The range continues to tighten as it consolidates below this area.
3996 has been support. A break below that could put 3965 to 3970 in play. That was support last week and around where the 10-day comes into play.

Above is the 30-minute chart of the ES. For now, I’d keep the 3995-ish area on watch as potential support, along with the 200-sma.
SPY

Honestly, the SPY trades pretty well, but it could use a “reset” trade back down into active support. In this case, a dip into the 10-day and 50-day moving averages would be attractive for dip-buyers. Plus, $390 is right in the vicinity too.
It’s trying to hold above the 200-day, which is healthy. If it can clear $399.10 again, it would open the door up toward $403.
On the downside, a break of $397 — yesterday’s low — could put a move lower back in play.
NQ

The NQ is running right into the 61.8% retracement. I’d love a dip into the 11,400 to 11,450 area. That zone is a reasonable area for support.
A move above 11,750 that sticks puts 12,000 and the declining 200-day in play.
QQQ

It’s nice having the Q’s back in the rotation. After 7 straight up-days and now into potential resistance, it’s hard to get uber-bullish.
A reset back down to the $275 to $277 area would be attractive for a dip-buy. If it fails as support, $270 is in play.
On the upside, a move over $283 could fuel a run to $293 to $295.
Open Positions
A note: After talking to some members, I want to make the setups a bit more clear. We are a trade-ideas service, but want to make entries & exits simpler to understand. We will be sending more updates, a few educational pieces and looking for a way to make our setups more clear in how we are managing them.
- Numbered are the trades that are open.
- Bold are the trades with recent updates.
- Italics show means the trade is closed.
— Any positions that get down to ¼ or less (AKA runners) are removed from the list below and left up to you to manage. My only suggestion would be, B/E or better stops.
From this latest round, that includes TLT, DE and FSLR.
- DE — Trimming down to ¼ on any push over $440. B/E stop or consider $425 as a new stop. Congrats! Look for $447 to $450+ on the runners
- COP — Long from $119, the 2x weekly-up. $124 to $127 could be a reasonable trim spot. Trimmed ¼ at the 50-day. d
- $116 Stop.
- BRK.B — ½ position — Needs to gain steam back over $320. Stop at $312.
- DAL — Anyone who caught DAL off the open on Friday should be down to ⅓ or ½ — or even completely out — as this is/was a short-term quick trade. B/E or better stop.
- If still long, trim on this morning’s push into $39 (pre-market is fine). $39.50 to $40 was the max limit for this idea.
- TJX — I am long from $81.40. But yesterday was an inside day, so traders who are not long but want to be can always wait for an inside-and-up rotation over $82.10.
- Targeting $83 as my first trim. $79 stop.
Go-To Watchlist
*Feel free to build your own trades off these relative strength leaders*
Relative strength leaders →
- SBUX
- DE — carrying runners in this trade!
- TJX, ULTA, NKE
- CAT
- BA & Airlines — AAL, DAL, UAL
- GE
- CAH
- SMCI
- MRK — weekly
- BRK.B
- FSLR — Carrying runners in this trade!
- XLE — XOM, CVX, COP, BP, EOG, PXD — (Weekly Charts)
Economic Calendar
Comments are closed