Our View
More than a week ago, I became a “hesitant bull,” thinking that the S&P could go up, but concerned by the overall downtrend that still looms in the market.
But we are not selling off right now! In fact, it’s quite the opposite. The S&P was up 9.1% in July, making it the best July since 1939. In addition to the big monthly gain, the ES has rallied 230 points or 5.9% from last Tuesday’s low — that’s 75 handles a day amid the index’s three-day run.
Despite some pretty rough earnings and economic reports, the S&P seems to be taking things in stride. The market is rallying on bad news — which is a bullish development — but I also think the current rally has also been part of a very oversized short position being squeezed out. Clearly, T+2 and all the end-of-month rebalancing only added fuel to the fire.
As I said last week, it’s been a perfect storm to the upside.
Our Lean
The first trading day of August has the Dow up 16 of the last 24 occasions (66.7%), but the first 9 trading days are historically weak. While we can’t rule out further advances, I also think you should not be surprised by a 50- pt 70-point selloff.
I’m not saying markets will tank today, but the higher it goes, the more likely it pulls back — especially in a downtrend. Also, the ES is approaching the 50% retracement of the 2022 range at 4223, That’s a critical level.
That all said, I want to sell the early rallies and buy the pullbacks if we gap up. If we open lower instead — which is looking more likely at the moment, then I may try to buy it for a scalp trade on the long side.
Daily Recap

The ES opened Friday’s regular session at 4089.75, sold off down to 4081 at 9:37 and then rallied ~42 points up to 4123.75 going into 10:30. From there, it dropped roughly 30 points down to 4093.50 at 11:34. After the drop, the ES traded back up to the 4112.50 level, back and filled in a narrow range then rallied up to 4121 at 12:58, pulled back the 4113.50 level and then rallied back up to the 4142.75 level at 3:36.
The ES traded up to 4144 — the session high — as the 3:50 cash imbalance showed $3.7 billion to buy and then dropped down to 4131 and traded 4133.75 on the 4:00 cash close. After 4:00 the ES sold off down to 4131 and settled at 4132.50, up 60 points or +1.5% on the day.
In the end, it was another early sell-off and an all-day buy program. In terms of the ES’s overall tone, it was firm all day. In terms of the ES’s overall trade, volume was slightly lower than Thursday’s volume, but still very steady at 1.92 million contracts traded. The S&P 500 notched its third-straight 1%-plus rally, the first time it’s done so since March.
- Daily Range: 63 points
- H: 4144
- L: 4081
Technical Edge
- NYSE Breadth: 69% Upside Volume
- NASDAQ Breadth: 57% Upside Volume
- VIX: ~$22.25
Game Plan: S&P 500, SPY
We are now entering a mixed moment in the markets, in my opinion. We have not seen the upside breadth we need to see (a return of demand) nor the capitulation we need to see in order to call a bottom.
That doesn’t mean this can’t be the low — it can — and it doesn’t mean the market can’t keep going higher — again, it could. So far, we’ve seen an admittedly impressive dead-cat bounce on low volume.
As a long-term bull, I hate saying that I don’t believe the low is in and while that observations could pan out to be wrong, that is what I’m seeing at the moment.
We are now rallying into a key area on the charts, but there have been many improvements. For instance, we’re rallying on “bad news” from the Fed and from lackluster earnings reports. Further, the Fed is forecast to be less aggressive here through year-end vs. what we’ve seen the last few months.
Can all of that point to an extended rally?
S&P 500 — ES

4100 was prior support in June, which held for more than a week as the ES digested a strong three-day move — sound familiar?
Perhaps that’s what we’re in store for again. However, the ES is now butting into the 21-week moving average (which was resistance on SPX and SPY this year), as well as the weekly vWAP measure.
Further, note that the ES is trading into a prior support zone between 4150 and 4200. It’s not unreasonable to speculate that this could be resistance.
If we should pull back in the days ahead, I’m looking for support from the 10-day ema and the 4000 level. On the upside, I expect us to slow down as the ES tussles with 4150 to 4200.
S&P 500 — SPY

Note how the 21-week moving average has rejected the SPY throughout this year and also note how we’re running into the 50% retracement from the June low to the March high.
On the downside, $407 is the first layer of support to watch. Below that opens up the far more significant level of interest near $400 and the 10-day ema.
On the upside, $415 to $417 appears to be likely resistance. However, a breakout above that level could open the door to the 200-day moving average.
I don’t like selling rip-roaring rallies (or buying plunging dips for that matter). But we are getting to a high R/R area where the ES/SPY/SPX will either break out over resistance (and sellers will quickly know if they’re wrong) or it will retreat back to the downside. As we rally into potential resistance, that R/R is improving for sellers.
Nasdaq — QQQ

I wanted to zoom out with a monthly view here, highlighting where we are on the QQQ.
We technically went monthly-up on Friday. If we can push above the July high near $316.50 and sustain above it, we could see a push to the 10-month moving average and even the 50% retrace at $339.
That said, we’ve been moving at a very orderly “three month stair-step” to the downside. Notice how the three-month highs tend to be clustered together before the next down leg.
While July marked the third month in the latest pattern, it ended higher on the month and near the highs, something both of the preceding “last month” in each respective leg couldn’t say (January and April).
CHNG

CHNG — I am still closely watching the $24 level. This is the breakout retest and the 10-day ema spot.
BA

Boeing is gapping up to $166.80 at the momentum, which was Q1 support and is the gap-fill level from May.
Beware of a potential fade from this zone this morning.
UUP
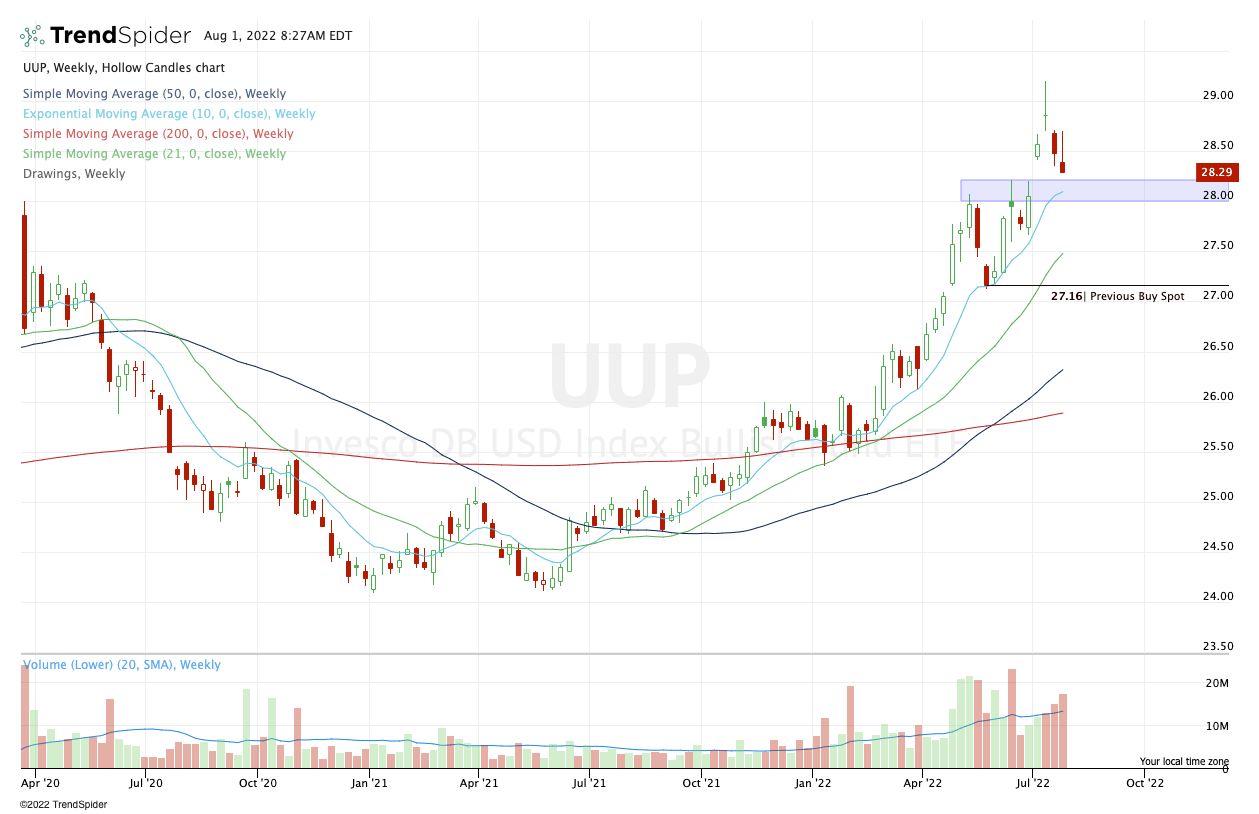
I am keeping a close eye on the $28 to $28.20 level, favoring the former as I would prefer a test of the 10-week.
The dollar has been a major winner for us lately and despite that “topping” look, it’s trend is still bullish for now.
Go-To Watchlist — Individual Stocks
*Feel free to build your own trades off these relative strength leaders*
- Numbered are the ones I’m watching most closely.
- Bold are the trades with recent updates.
- Italics show means the trade is closed.
Trade Sheets: I am quite pleased with how our individual trades have worked out. I guess with July enjoying its best month in almost 100 years though, it should be this week for our individual plays!!
- MCK — We have hit two trim zones so far on MCK. Feel free to cash the last ⅓ of the position as you see fit. $335 to $340 is a potential upside target (and has since been hit).
- Moving stop-loss up to $315 and given the consolidation, I am thinking of holding my last ⅓ for a push to $348 to $350.
- PEP — Beautiful move into the $175s! I am trimmed down to a ½ position with a break-even stop & looking to trim down to a ⅓ or ¼ position into $177 resistance.
- COST — Absolute banger of a trade, now trading $540+ and we are down to a ⅓ position. I would consider moving to a stop-loss of ~$520 (profitable vs. our cost basis) and just letting this one ride a bit.
- Take profits when it suits you. If we see $545 to $550 I will likely reduce down to runners or exit completely.
Relative strength leaders (List is cleaned up and shorter!) →
- O
- CNC
- HRB
- ENPH — kickstarted the rally in Solar
- TAN
- FSLR
- MSTR
- LNG
- PWR
- CHNG
- COST — trade is live
- PEP — trade is live
- BA —
- UNH
- XLE
- VRTX
- MCK — trade is live
Economic Calendar

As we all know, there’s no crystal ball when it comes to trading stocks, options, or futures. But the Market Imbalance Meter may be as close as it comes. Knowing how the “Big Money” is placing its bets can give our trading room a big wave to ride — or a warning sign to stay out of the water. Come check it out now, risk-free for 30 days.
Comments are closed