But the trend has been with the bulls.
Follow @MrTopStep and @BretKenwell on Twitter and please share if you find our work valuable.
Our View
I think it’s fair to say that the ES is “taking bad news and making good of it.”
Today we will get a look at the PPI numbers. While this number does not provide the same response as the CPI, it can move the markets. Look, I don’t want to beat a dead cat: The ES is stuck in a 4110-4185 trading range. Is today the day it busts out?
I don’t think so.
While I can’t rule out a stop-run out of the range, the question is, can the move sustain in that direction? That, I don’t know. In other words, don’t be a chaser (aka buying strength and selling weakness). If you are late to the party, just be patient.
Our Lean
The ES initially dumped lower on the CPI, but it was a good close for the ES. However, this market has been a fading machine lately and the algos have worked perfectly within the range. If you play along with them, do as they do…buy the dip, let them rally, and sell the rip until further notice.
If you asked me if I am bullish or bearish, I would tell you I’m neither. If I had a gun to my head? The ES pops, gets everyone long, and then pulls back, just as it’s done day after day.
Friday’s Stock Trader’s Almanac shows this Friday (Opex) as having the Nasdaq up 7 of the last 13, while the day before Presidents’ Day weekend has the S&P up 10 of the last 12. The week after this tends to be mixed, but the final week of February tends to be “miserable.”
MiM and Daily Recap

The ES traded down to 4116 on Globex and opened Wednesday’s regular session at 4122. From there it rallied up 4135, dipped to 4123, rallied up to 4134.75, and then traded down to 4115.50 at 9:55. Ultimately, it popped up to 4146.50 at 11:46. The ES pulled back to the 4126.50 level at 12:35, rallied up to 4154 at 2:15, pulled back to the 4147 area and rallied up to a lower high at 4154 at 2:45, then sold off down to 4141.75 at 2:59.
The ES chopped between 4140 to 4150 until late in the day, traded 4151.75 as the 3:50 cash imbalance flipped to $525 to sell. The ES traded 4158.75 on the 4:00 cash close and tip-toed higher into the 5:00 settlement, closing at 4149.50, up 12.75 points or 0.3%.
In the end, it’s essential to remember the trading range. You can’t sell under 4110 and you can’t buy above 4180-90. In terms of the ES’s overall tone, it was firm. In terms of the ES’s overall trade, volume was low at 1.56 million contracts traded.
Technical Edge
- NYSE Breadth: 55% Upside Volume
- Advance/Decline: 64% Advance
- VIX: ~$18.75
There has been some weird action lately. Despite a hot CPI report, the Street isn’t pounding on the S&P and it’s especially not pounding on tech stocks. Many high-growth names are screaming to the upside as they are now reporting earnings.
Despite the prospect of higher rates for a longer period of time, investors don’t seem to care at the moment. For example, a month ago, the market was pricing in just a 3.5% chance of rates sitting at the 5% to 5.25% range in December. Those odds climbed to 28.5% last week.
Now? That’s the base-case assumption, with odds at 36.2%.
Investors also don’t seem to care that the 10-year yield hit its highest level of the year on Wednesday or that the dollar index is at a one-month high. Bonds are at a multi-week low, while the 2-year/10-year and 3-month/10-year spreads are at or near the deepest levels since the correction began.
Those spreads are flashing a recession warning, but strong retail sales and a stubbornly high employment situation have many investors wondering if a true recession is on the horizon — or if the Fed will actually hike to the point where they manifest a recession.
All of these cross-currents seem to be showing on the charts — at least, IMO — as the S&P refuses to break out over multi-quarter resistance but has been trending higher.
While there are multiple catalysts for both the bulls and the bears, it’s hard to argue with the recent trend, which has been higher.
And one last thought: Has anyone bothered to ask what could happen if the Fed does get inflation under control while avoiding a recession (or only enduring a small hiccup?) Anyway, onto the charts.
S&P 500 — ES

Above is the 30-min chart for the ES. Let’s see if ~4125 holds as support on a dip. Below that could put yesterday’s low in play.
Keeping it simple today: I want to see how the ES handles these levels. Keep in mind, the CPI low of ~4104 could be a pivot area for the ES if we see it today.
On the upside, 4160 to 4168 is resistance. Above it and 4185 is in play.
SPY

The SPY is near resistance again but still within the CPI doji range. Above $414 and $416.50 is on the table.
On the downside, things could get pretty sloppy below $409.50, putting the 21-day sma back in play, along with last week’s low near $405.
DIA

Man, look at how tight the Dow has gotten — which goes for the DIA and the /YM.
Look for a move over the January high near $349.50. A monthly-up could kickstart a larger move to the upside and get us long this name.
An hourly close above this mark would be enough to get me interested. A daily close above it and I’m likely long. For the YM, that level is 34,489.
Initial stop would be $335.
Natural Gas — /NG
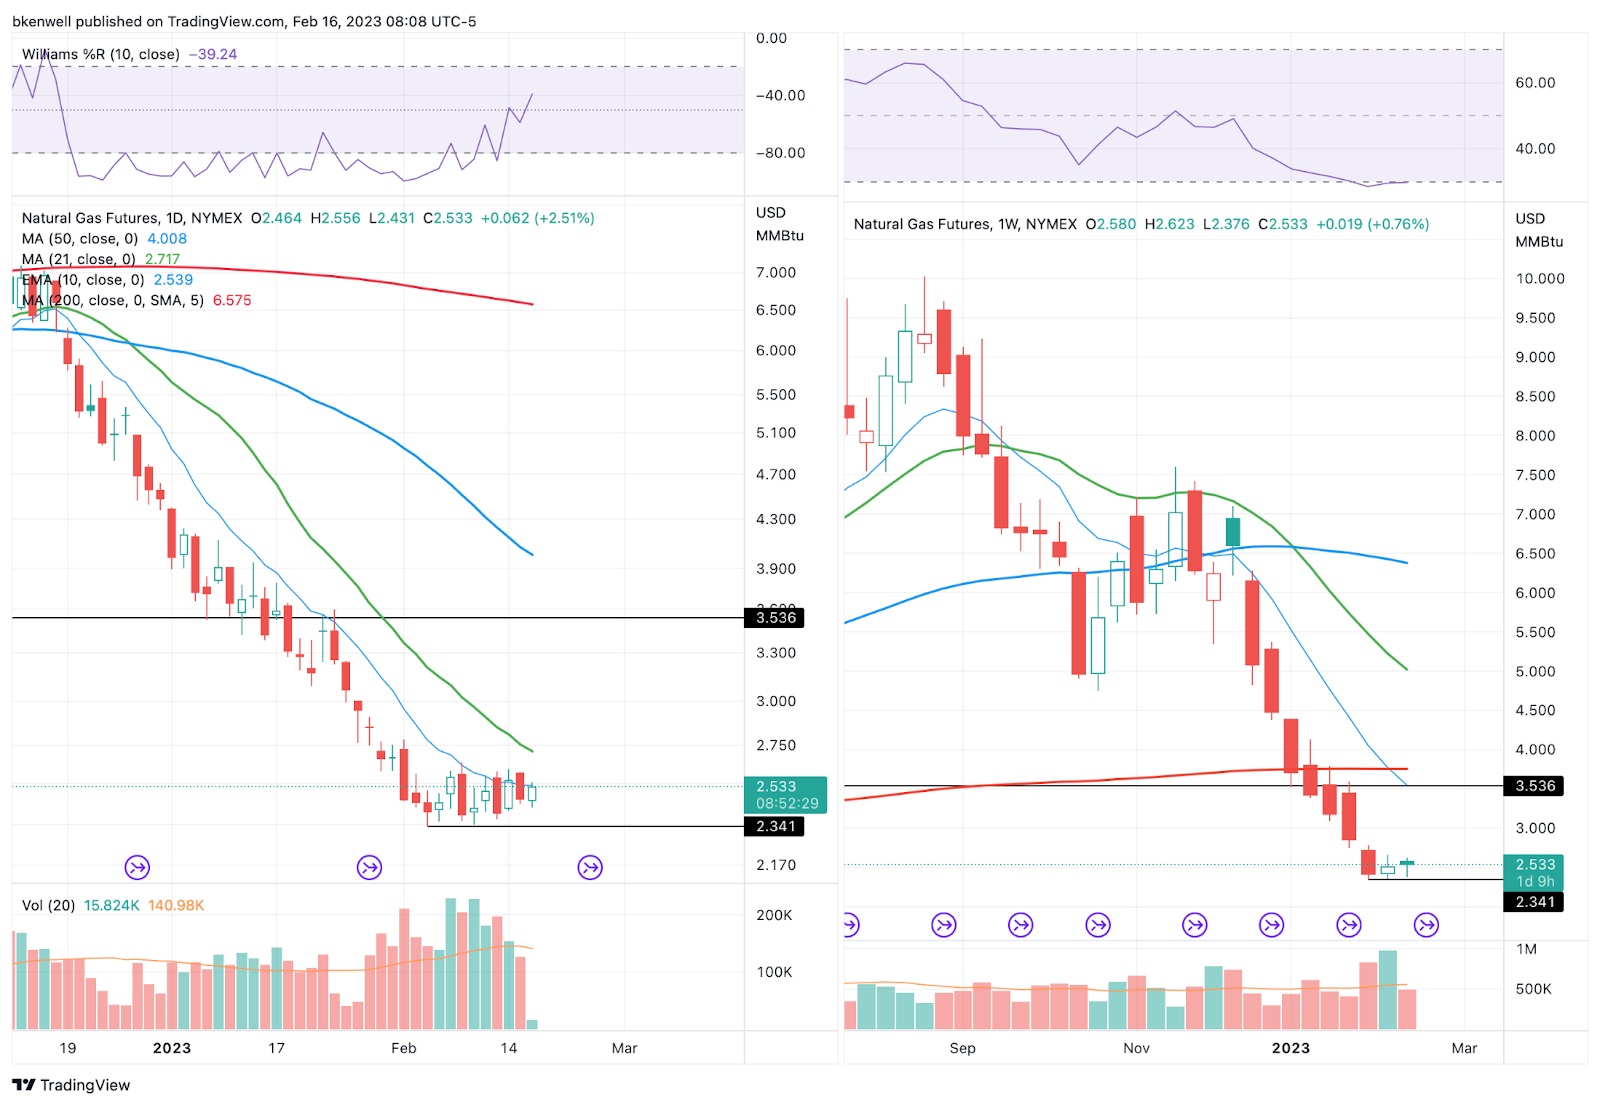
Nat Gas is one I have been keeping a close eye on. Every time it seems to gain some steam, it peters out again. This name has been a widowmaker over the past few months and I don’t want anyone in this group to join the list. In that regard, UNG is a way to play as well.
However, after getting crushed, NG is finding support down in the $2.30 to $2.50 area. If it can go weekly-up over $2.66 and close above this mark, it could kickstart a much larger upside move.
$2.75 would be one area to clear, but above that and there’s not much in the way to $3.00 to $3.10, then $3.50.
I think NG is trying to base and rotate higher.
Open Positions
- Bold are the trades with recent updates.
- Italics show means the trade is closed.
- Any positions that get down to ¼ or less (AKA runners) are removed from the list below and left up to you to manage. My only suggestion would be B/E or better stops.)
- ** = previous trade setup we are stalking.
- NVDA — long from $210 & Trimmed ⅓ at $219+, $223+ and $230
- Absolute beauty thus far. Down to ¼ against a B/E or better stop. Up to you on how to manage from here
- AMD — trimmed down to ½ position at $85 to 86. Trim down to ⅓ if we see $87+
- Stop-loss of B/E or better now
- **CAT — long on a weekly up rotation over $252.14. First target would be $258 to $261. Stop at $242.
Go-To Watchlist
*Feel free to build your own trades off these relative strength leaders*
Relative strength leaders →
- AQUA
- AEHR
- GE
- NVDA, TSLA, SHOP
- SBUX
- MELI
- NFLX
- WYNN, LVS
- AXP
- BA & Airlines — AAL, DAL, UAL
- TJX, ULTA, NKE
- CAT
- HCCI
- XLE — XOM, CVX, COP, BP, EOG, PXD — (Weekly Charts)
Economic Calendar

Comments are closed