The S&P is starting with a potential weekly-down rotation.
Follow @MrTopStep and @BretKenwell on Twitter and please share if you find our work valuable.
Our View
“Fryday’s” MEGA $1.8 trillion in options expiring led to a choppy, dull fud. One of the things I want to express is that you simply can’t sell the ES when it’s down and you can’t buy the gap-up opens. I don’t know how long that observation will ring true, but a big part of trading successfully is knowing the environment.
I am 100% sure the bots buy the cheaper prices on the open (the gap-downs) and sell the expensive prices on the gap-ups. Either way, the algos are fading the gaps — a program that generally makes money each time it’s deployed.
On Friday, the ES rallied first and then fell, but after the drop, the selling dried up and that’s when the algos started pushing the ES and NQ up into the stops.
I am not saying this works every time but it works very well in an established trading range — and it works especially well during a choppy tape, which we had during Opex.
Our Lean
The ES and NQ have been moving higher this year as the public continues to dive into last year’s big losers — like tech, crypto, and electric cars — while overlooking the Fed’s warnings.
As the rate hikes and warnings continue, the markets have started to reverse over the last few weeks. The DAX has outperformed the US indices and has also started to retreat, falling almost 250 points from Monday’s high and was down 370 points off its high for the year. I think this type of price action will continue this week.
Our lean: I can’t rule out buying the gap downs or early weakness, but I also think this decline is not over and that the money trade is selling the rallies, which recently have been 40 to 50-point short-covering rallies.
On the downside, 4050 to 4055, 4035, and 4000 are the big levels to watch. On the upside, 4100 is the big one.
MiM and Daily Recap
The ES traded down to 4073 on Globex and opened Friday’s regular session at 4076.25. It rallied up to 4080, dropped down to 4061.50, and then rallied up to 4075.25 at 12:10. The ES reversed back down to 4055.75 at 12:50 and stutter-stepped back up 4090.50 at 3:00. The ES pulled back to the 4080 area, then rallied up to 4090.50 and pulled back to the 4079.50 level at 3:45.
The ES traded 4079.75 as the 3:50 cash imbalance showed $162 million to buy, rallied up to 4089.50, and traded 4087.50 on the 4:00 cash close. After 4:00, the ES traded between 4089 and 4085.25 and settled at 4085.75 on the 5:00 futures close, down 14 points or 0.34% on the day.
In the end, the early weakness led to another short-covering rally. In terms of the ES’s overall tone, the ES was weak but not overly. In terms of the ES’s overall trade, volume was steady at 1.94 million contracts traded.
Bonds finally closed higher and the dollar backed off the highs. Crude slipped by $2.19 a barrel, while the Dow and Russell finished higher even as the S&P and Nasdaq fell.
** Globex Session **
When the S&P opened Sunday night, it came in at 4085.75 and in the first 30 minutes of trade it slipped down to 4076. From there, it proceeded to rally up to 4089.25 and then it traded in a downward channel until the 12 o’clock close and stopped trading at 4075.75.
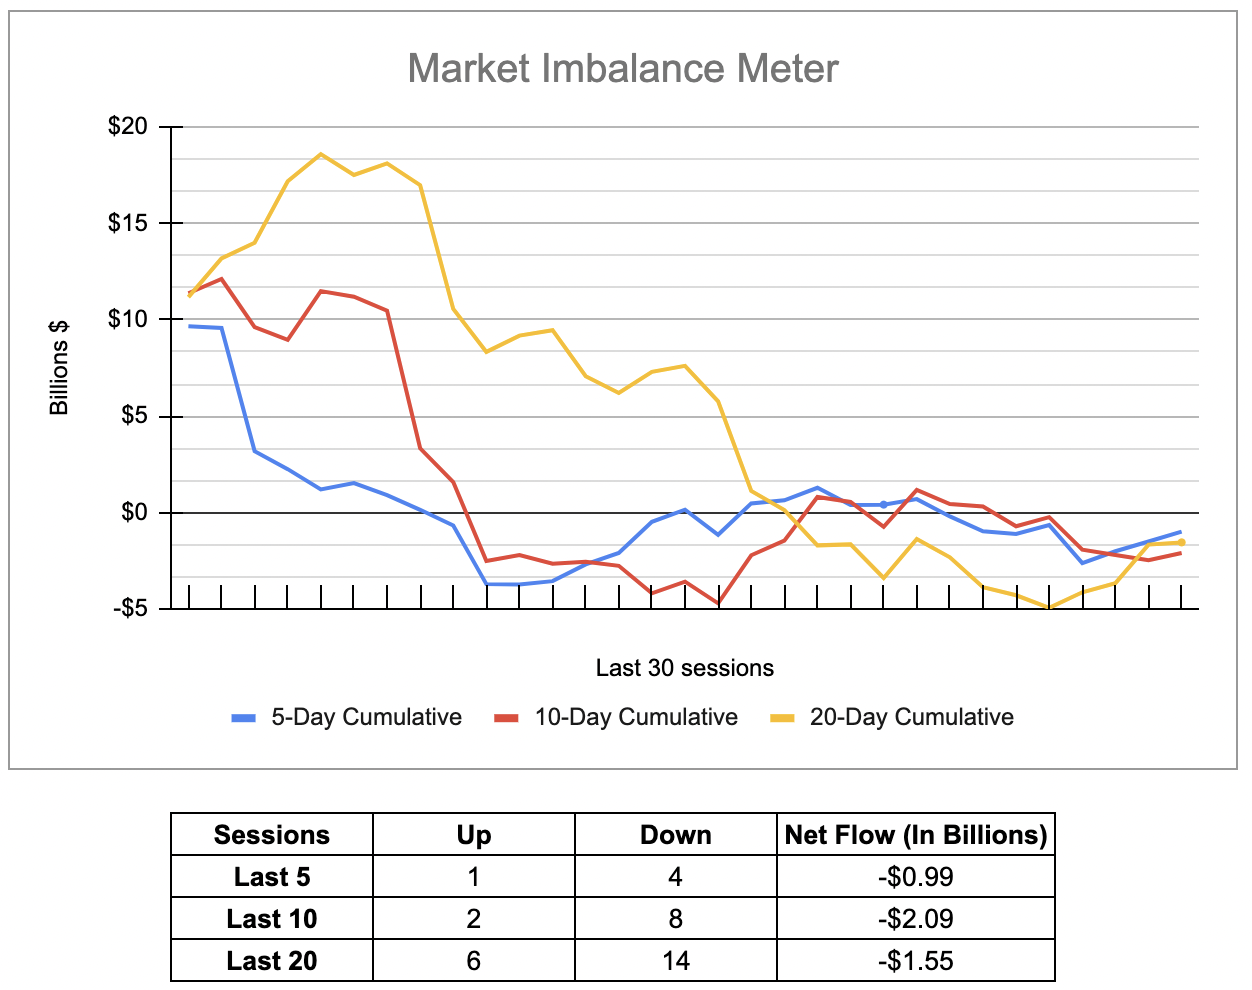
Technical Edge
- NYSE Breadth: 36% Upside Volume
- Advance/Decline: 41% Advance
- VIX: ~$20
It was not technically an inside week, but it may as well have been. Despite some weakness late in the week, the S&P continues to hold above its trend.
The question marks are starting to pile up, though. Inflation data — as viewed via the CPI and PPI reports — came in hot. While the Fed said it will look for a slower pace in regard to rate hikes, it’s still raising rates going forward.
I’m surprised the markets are not under more pressure here, as the hot jobs reports from a few weeks ago coupled with the inflation report last week should be enough to put the Fed in a tough spot. So far though, the bulls aren’t blinking. We’re now seeing some early weakness with the potential for a weekly down rotation in play this morning.
This week: I want to keep an eye on yields (TNX) and the dollar (DXY). S&P bulls need to see continued weakness in these assets to help buoy stock prices. If they rally instead, more pressure could lie ahead.
S&P 500 — ES
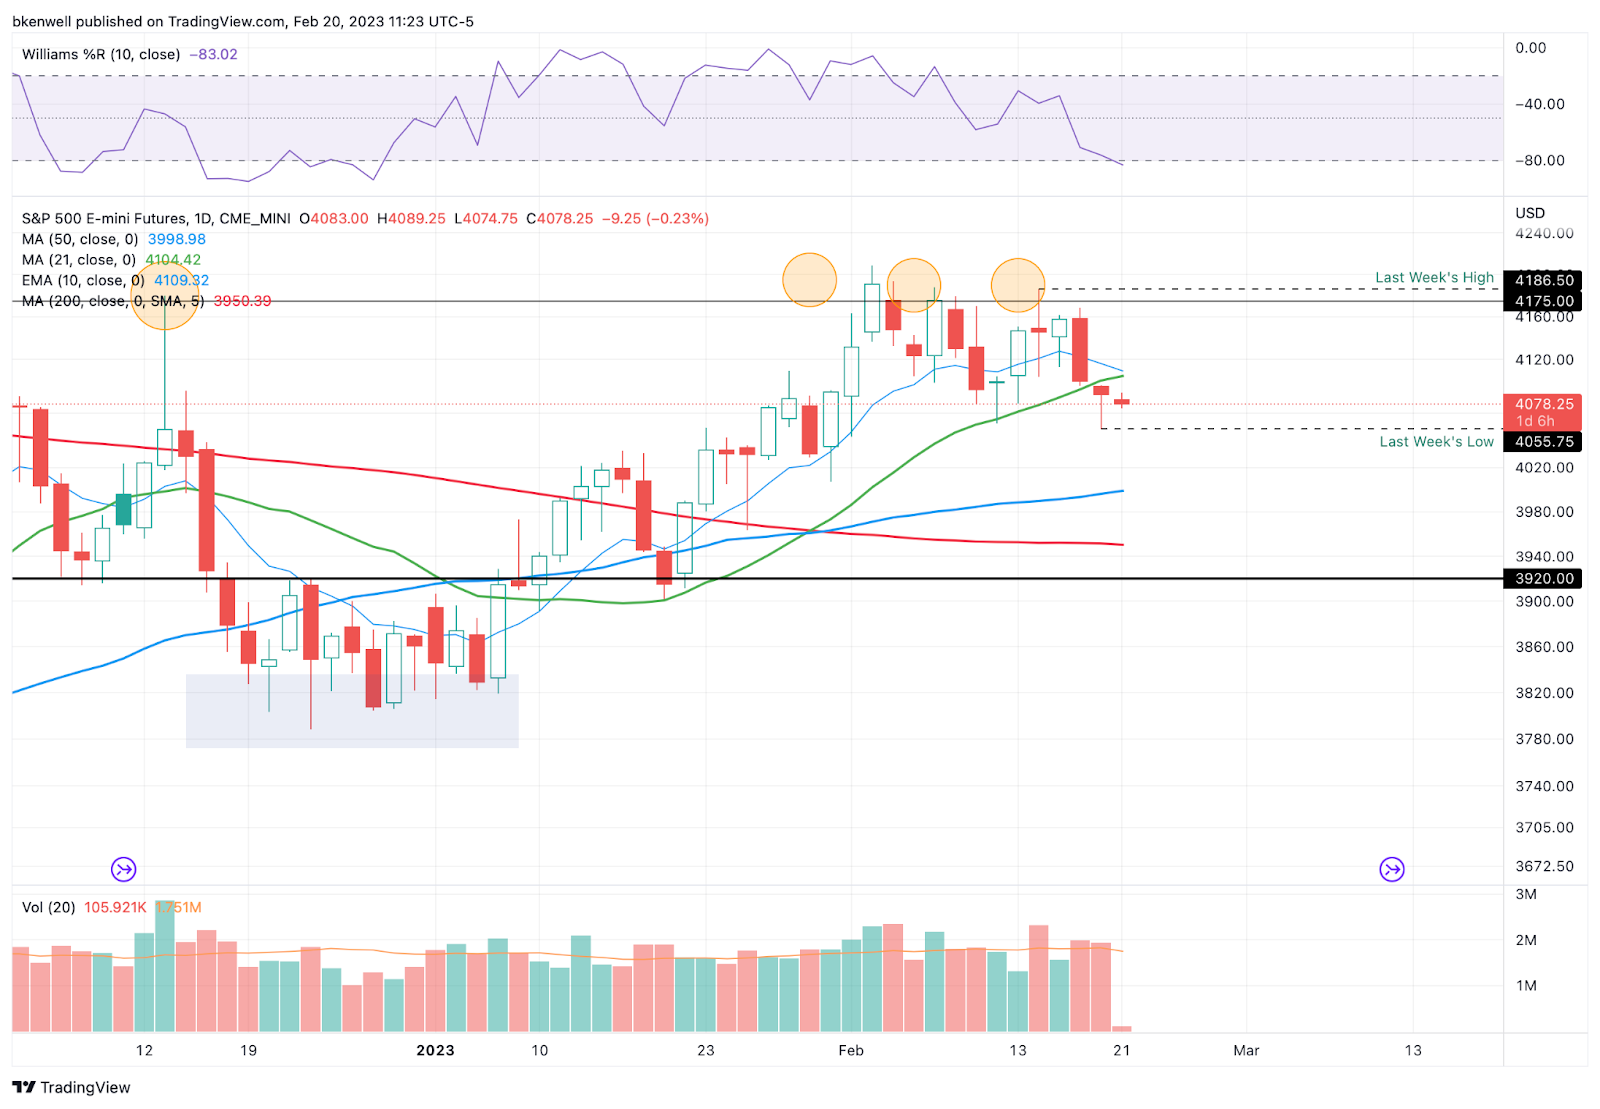
Friday was fun. We were watching the prior week’s low near 4060 to see if we could “test/crack this level and reclaim it for a bounce” and that’s exactly what happened, as the ES bottomed at 4055.75 and closed higher by more than 30 points from that point.
So far though, the charts remain largely the same. That is to say, trapped between 4050 on the downside and 4175 on the upside.
More specifically:
Let’s see who takes control right off the bat. If it’s the bears, a clean break of last week’s low at ~4056 is the goal. So far this morning, that level is flirting with a break. That would also put the ES below several weeks of lows.
On the upside, the key levels are 4096, then 4110. Above the 10-day ema puts 4120 and 4135 are in play.
Here’s one more look at the weekly:
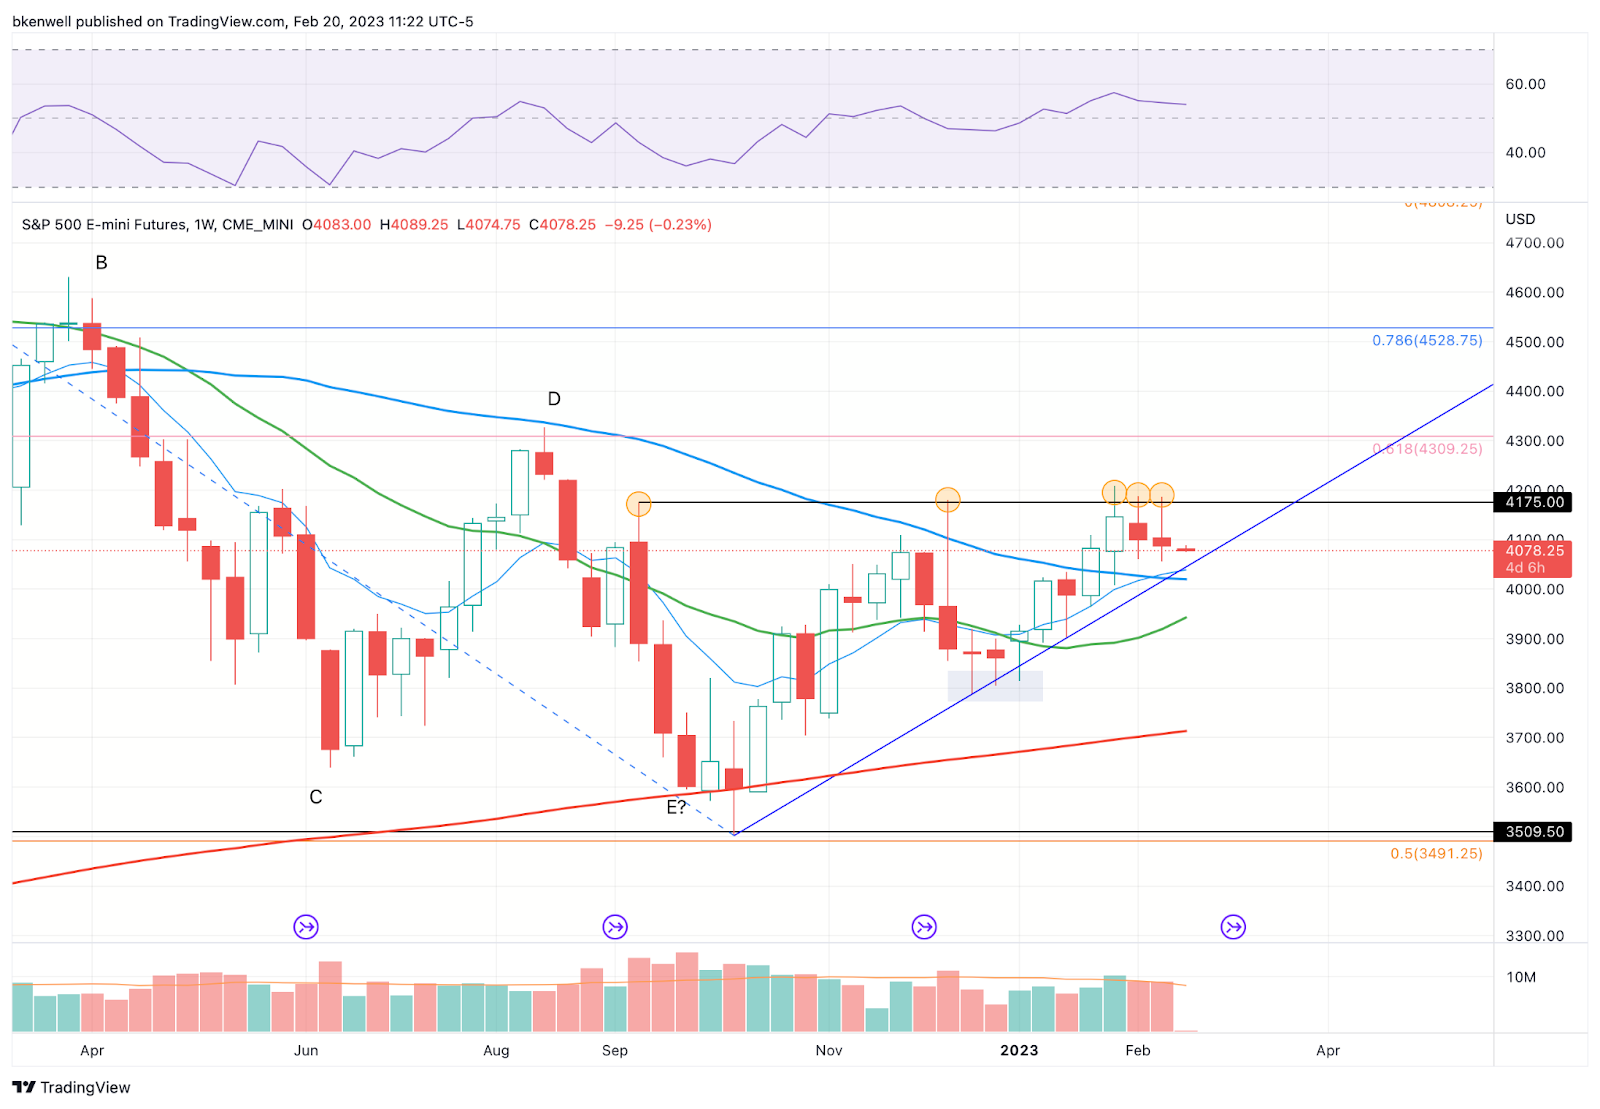
Below that and of course, 4000 + the 50-day is screaming out for a test.
SPY

Friday morning’s dip buy panned out for a trade, but the daily chart leaves more to be desired.
Despite a solid bounce, the SPY is below the 10-day and 21-day moving averages, as well as the key $410 level that we’ve pivoted around for the last few weeks.
Try to keep this simple. Above $410 and bulls can regain some control. However, a quick weekly-down below $404 could have $400 in play.
It would also have me wondering about a potential test of the 50% retracement and 50-day moving average near $396.50.
Bonds — TLT
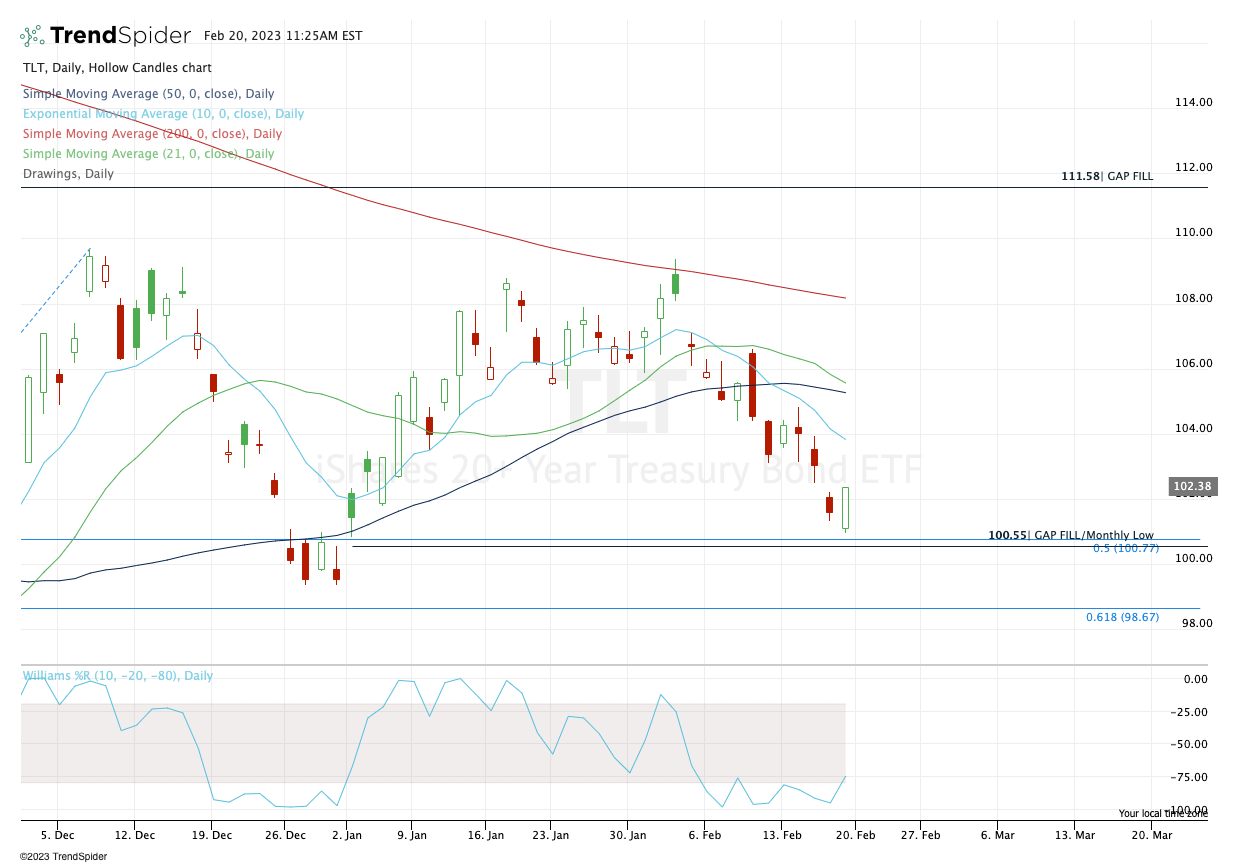
Just missing our mid-$100 buy zone, the TLT put in a bullish engulfing stick on Friday.
I don’t have any, but above Friday’s $102.38 high puts the declining 10-ema in play. If the TLT erases Friday’s gains, it’s an ugly look.
AAPL

Daily-up over $153 could give us a long trigger. Would want a 15-minute close and hold above this level to set it up. Initial Stop at $150. Sniffing for $154.50 to $155 as first target.
When I wrote this on Sunday, we didn’t have pre-market action, which now likely takes this setup out of play. Still, keep it on your radar today.
MRK
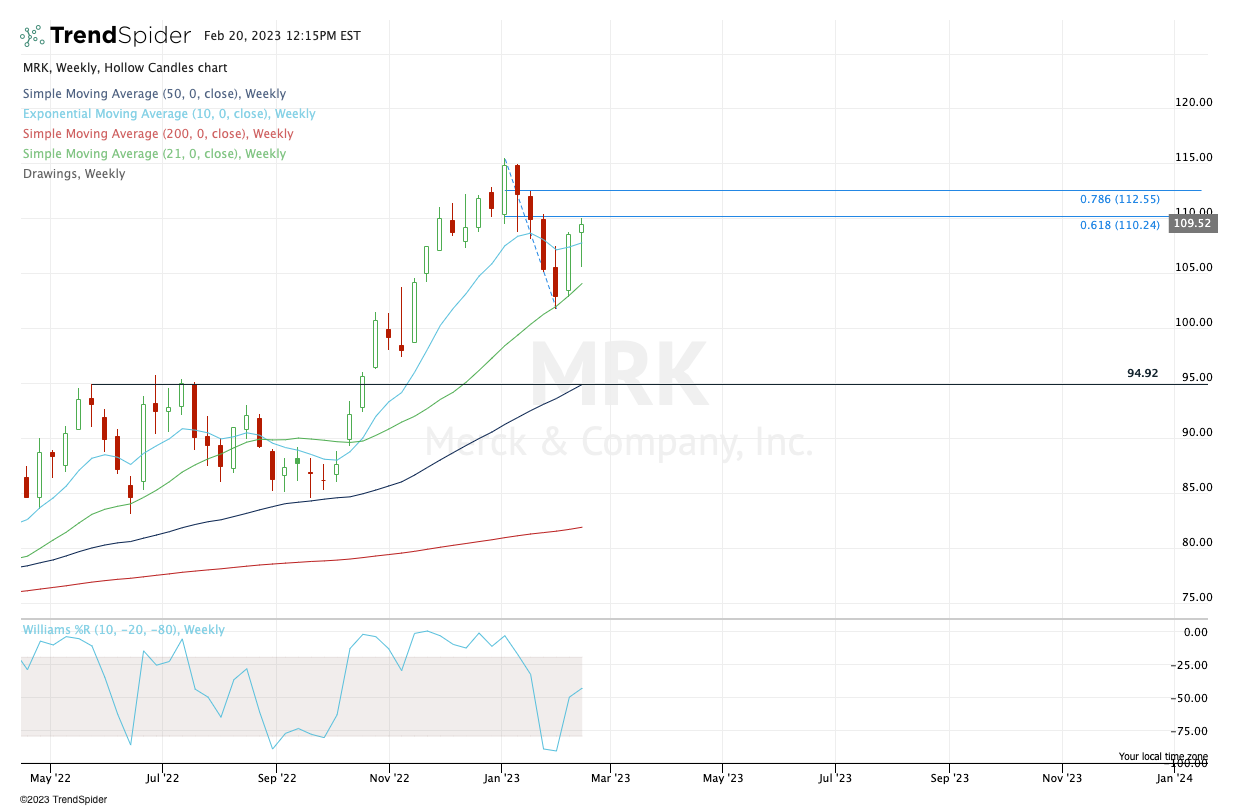
Watch this one over the next few days. A weekly-up over $110 could quickly put $112.50+ in play and a continuation to the upside.
The one hang-up here is the 61.8% retrace, which MRK hit last week. That said, over $110 without reversing lower and this one may want higher yet again.
Initial stop can be this week’s low if it gives enough room (say $107 to $108) or initially could be last week’s low near $105 for those comfortable with the risk.
Open Positions
- Bold are the trades with recent updates.
- Italics show means the trade is closed.
- Any positions that get down to ¼ or less (AKA runners) are removed from the list below and left up to you to manage. My only suggestion would be B/E or better stops.)
- ** = previous trade setup we are stalking.
- NVDA — long from $210 & Trimmed ⅓ at $219+, $223+ and $230
- Absolute beauty thus far. Down to ¼ against a B/E or better stop. Up to you on how to manage from here — EPS THIS WEEK.
- **CAT — adjust to long on a weekly up rotation over $251. First target would be $258 to $261. Stop at $244.
Go-To Watchlist
*Feel free to build your own trades off these relative strength leaders*
Relative strength leaders →
- AQUA
- AEHR
- GE
- NVDA, TSLA, SHOP
- SBUX
- MELI
- NFLX
- WYNN, LVS
- AXP
- BA & Airlines — AAL, DAL, UAL
- TJX, ULTA, NKE
- CAT
- HCCI
- XLE — XOM, CVX, COP, BP, EOG, PXD — (Weekly Charts)
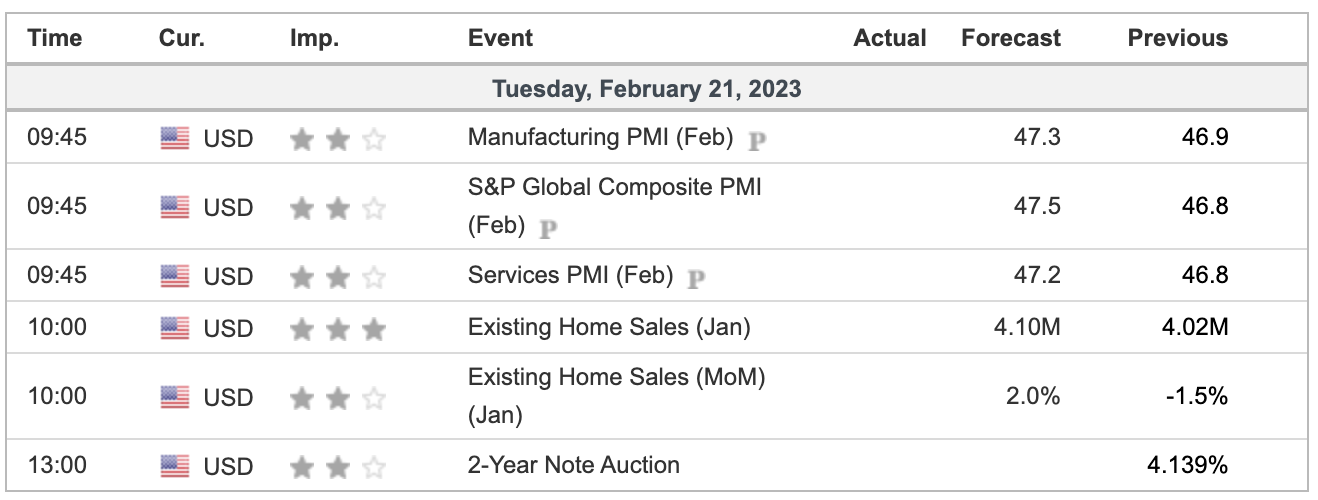
Economic Calendar
Comments are closed