Several individual stock trades stand out now.
Follow @MrTopStep and @BretKenwell on Twitter and please share if you find our work valuable.
Our View
Do you know what the biggest rally killer is? The Fed talking about rates over 5%. As earnings shrink and more and more layoffs hit, it’s going to be hard to keep a positive face about the economy.
Remember, the stock market is a forward-looking and discounting mechanism. At some point, it will price in lower rates. But with the Fed talking about raising and maintaining “higher for longer” interest rates, combined with a deteriorating economy…well, that’s a concern.
The ES rallied almost 250 points from the Dec. 22 low and then dropped 90 points from yesterday’s high to the session low. Accounting for Globex, the ES has fallen 120 points in less than two days — Half the rally, gone like *that.*
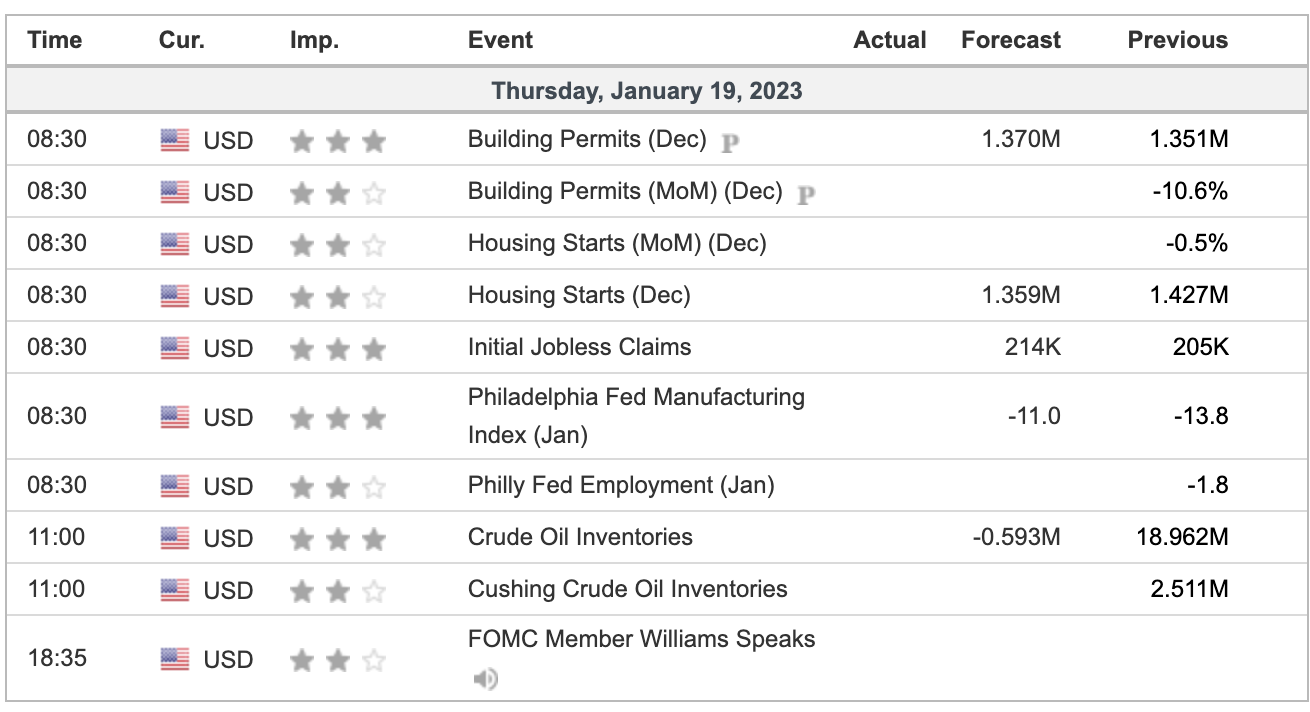
Today we have another batch of earnings, eco reports and Fed speak. The latter two are down below in the Economic Section, while we’ll get PG and some regional bank earnings before the open. NFLX is after the close.
Oh yeah, and expect plenty of debt ceiling headlines today.
Our Lean
We were right about selling the early rallies, but the buy-the-dip stuff wasn’t. It has worked for several weeks, but that trend changed yesterday. Wednesday was another great example of how fast a Fed headline can change things.
The PitBull had a negative bias yesterday and bought puts early, but was amazed at the late afternoon chops.
Our Lean: We can’t rule out some early rallies, but we think you have to sell them. And remember what you see in the first part of the day usually isn’t what you see later.
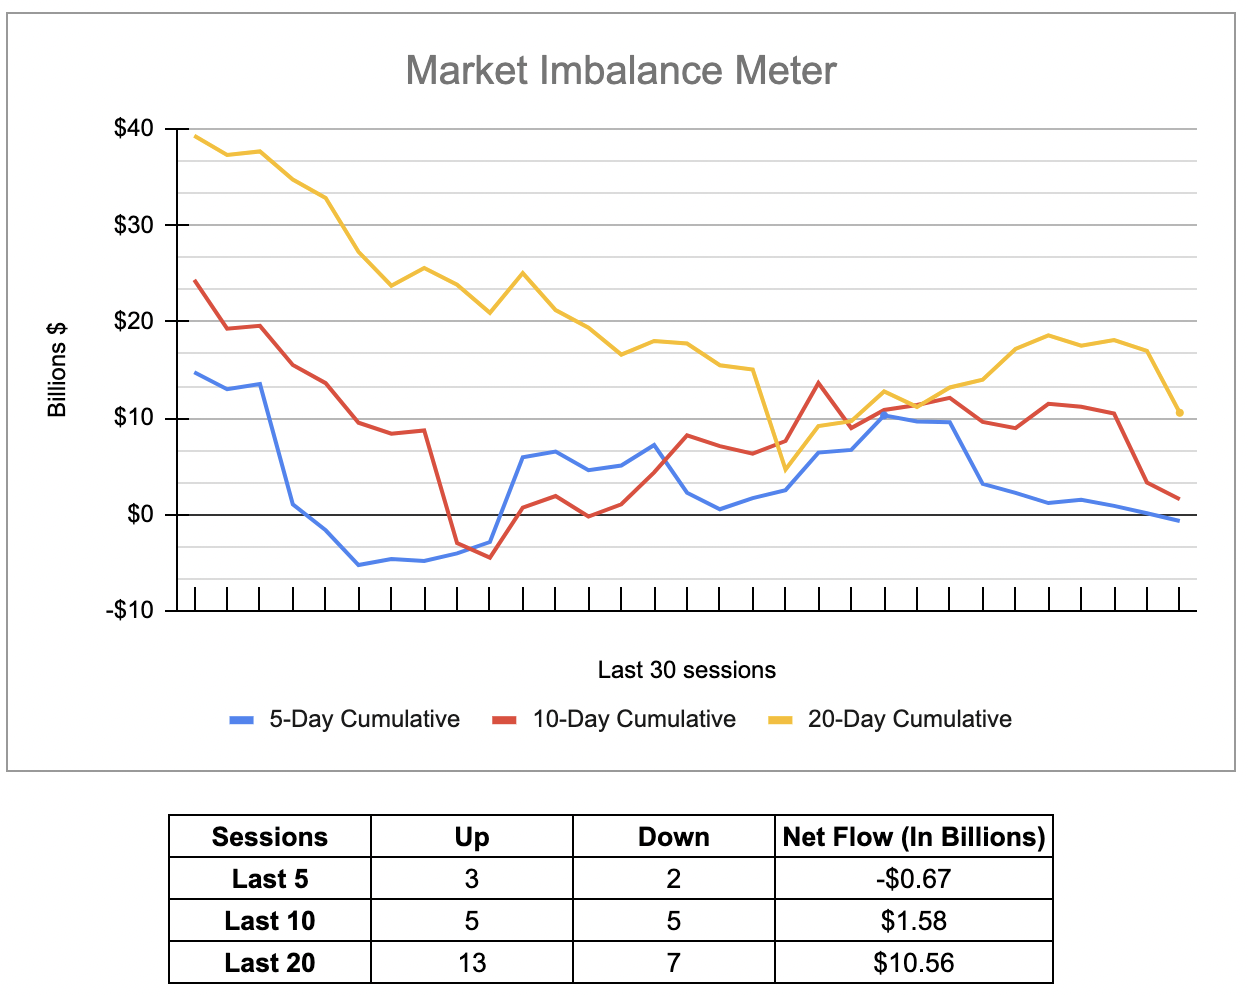
In the last two days, the 3:50 cash imbalance has off-loaded almost $5 billion in stocks — and as you’ll see below, has gone negative over the trailing five days.
PS: Remember the Dax we mentioned earlier this year? It’s pulling back into active support. That gives the bulls a shot on the long side. If it fails, the 14,530 to 14,570 area is of interest.

MiM and Daily Recap
The ES sold off down to 3996 on Globex and opened Wednesday’s session at 4022. The ES made an early low at 3915.75, then ground higher and traded 4033.50 at 10:09. From there, it dropped 68 points down to 3965 at 12:31. After a small uptick to the 3972.50 level, the ES traded down to the 3956.50 level at 2:13, bounced back up to 3971.75 at 1:45, sold off a little and chopped in a 6-point chop for 50 minutes when a bunch of NQ buy imbalances started showing up pushing the ES back up to 3970.25 at 2:35.
Still, it fell back down and traded 3949 as the 3:50 cash imbalance showed $2.4 billion to sell, traded a low of 3943.75 after the MIM, and traded 3945.50 at the 4:00 cash close. That’s essentially where it settled — at 3945.75 — on the 5:00 futures close, down 63.75 points or -1.59% on the day.
The ES and NQ reversed lower after St. Louis Fed President James Bullard told the Wall Street Journal Nick Timiraos that the Fed should keep rapidly raising interest rates until they get above 5%. which was not received well by traders betting on a 1/4 rate hike at the central bank’s next meeting. In terms of the ES’s overall tone, it was weak. In terms of the ESs overall trade, volume was decent at 1.837 million contracts traded.
Technical Edge

“The ES remains trapped below last week’s high and its long-term downtrend resistance mark.”
Resistance proved to be a problem for the S&P, as it now rolls over and is, for the moment, failing to hold support. The S&P is quickly unraveling and for bulls, it’s alarming how quickly it’s cutting through the 10-day and 50-day, as well the 3920 level.
If the 3910-ish area holds as support and the ES reclaims 3920, then a bounce back to the 50-day could be in the cards — even if they sell the bounce.
Otherwise, a larger unwind down to last week’s low and the 61.8% are looking more likely, down at 3891 and 3883, respectively.
SPY

Yesterday I asked for a reset, not an unraveling! Wednesday’s close left the SPY at the 10-day and 50-day moving averages and above $390. In the premarket, it’s trading $388.
Look to see if we can reclaim $390, which puts yesterday’s low and the gap-fill back in play.
Otherwise, last week’s low could act as a magnet near $386.25. That’s also the top of that prior trading range we were recently stuck in, as well as the 21-day sma.
QQQ

A clean rejection out of that $283 area as the QQQ now finds itself on its heels after a bearish engulfing candle yesterday.
Currently trading near $275.50 in the pre-market, the Qs will open right on the 10-day if they remain unchanged until 9:30. If that’s the case, we may get an early push to try and fill the gap up at $277.67.
So step 1 is to see if this support area holds — that being the 10-day. Step 2 is to see if we make a push for the gap-fill.
If support fails, the $269 to $270 area could be in the cards.
Individual Setups
Watch for that setup in MRK today, as it’s set to open at the 50-day. If so inclined, you can always go with a smaller position size to account for the volatility.
Others that stick out to me with the strongest trend and pulling back include NKE, SBUX, and GE. These would be my top three.
CAT and UAL look interesting as well.
Here’s an example, with NKE:

A monstrous Post-Earnings rally and now cooling off has NKE set to test its 10-day ema for the first time in weeks.
Aggressive bulls can buy this test. They can do so with a smaller position size if they wish. They don’t want to see NKE lose $123 to $123.50.
On a bounce, they’d consider trimming near the gap-fill (126 to 126.50), then the 50% to 61.8% retracements (127 to 127.50).
This is a trade. It may fail. It may result in a stop-out. We size our trades to endure consecutive, repetitive drawdowns, with stop-gates in between to mitigate account damage. Each trade risk is small, so no one trade is a maker or breaker on the account. That is how you live to trade another day, even after you miss 10 in a row.
Open Positions
A note: After talking to some members, I want to make the setups a bit more clear. We are a trade-ideas service, but want to make entries & exits simpler to understand. We will be sending more updates, a few educational pieces and looking for a way to make our setups more clear in how we are managing them.
- Numbered are the trades that are open.
- Bold are the trades with recent updates.
- Italics show means the trade is closed.
— Any positions that get down to ¼ or less (AKA runners) are removed from the list below and left up to you to manage. My only suggestion would be, B/E or better stops.
From this latest round, that includes TLT, DE and FSLR.
- COP — Long from $119, the 2x weekly-up. $124 to $127 could be a reasonable trim spot. Trimmed ¼ at the 50-day. We got our first trim & some messaged to say they got a second near yesterday’s HOD. (I didn’t).
- If you didn’t get out with a B/E stop, then stay disciplined with your original stop. Mine was $116.
- BRK.B — ½ position — Needs to gain steam back over $320. Stop at $312.
- DAL — Anyone who caught DAL off the open on Friday should be down to ⅓ or ½ — or even completely out — as this is/was a short-term quick trade. B/E or better stop.
- If still long, trim on this morning’s push into $39 (pre-market is fine). $39.50 to $40 was the max limit for this idea.
- TJX — I am long from $81.40. But yesterday was an inside day, so traders who are not long but want to be can always wait for an inside-and-up rotation over $82.10.
- Targeting $83 as my first trim. $79 stop.
Go-To Watchlist
*Feel free to build your own trades off these relative strength leaders*
Relative strength leaders →
- SBUX
- DE — carrying runners in this trade!
- TJX, ULTA, NKE
- CAT
- BA & Airlines — AAL, DAL, UAL
- GE
- CAH
- SMCI
- MRK — weekly
- FSLR — Carrying runners in this trade!
- XLE — XOM, CVX, COP, BP, EOG, PXD — (Weekly Charts)
Economic Calendar
Comments are closed