The S&P roared higher then whimpered into the close.
Follow @MrTopStep and @BretKenwell on Twitter and please share if you find our work valuable.
Our View
The ES shook off the two-day 120-point selloff and traded above last week’s high. Today’s only economic report is the December PMI and MSFT reports after the close.
I want to make myself very clear, I am an equal-opportunity trader. I have been bearish for a very long time and am one of the few people that came into 2022 expecting a large drawdown in the S&P (although I did not expect what ultimately unraveled). That said, I am generally a bull and prefer to be.
But above all, I am an equal-opportunity trader and will play either side. That’s what 30+ years in the pits will ingrain in you. If the ES is going up or down, I want to go for the ride.
xx
One of the top stories in the Wall Street Journal is: Fed Set Course for Milder Interest Rate Rise in February.
The Fed has telegraphed slowing the pace of the rate increases to a more traditional .25 bps. Remember in October when everyone was saying the Fed would overshoot? Since then, Powell has stuck to a hard line that the Fed was not finished with its rate hikes.
The consensus seems to be two more quarter-point hikes and then hold steady. The question is, is it just “two more hikes” and how long will the Fed hold ~5% rates? For what it’s worth, by September the market is pricing in odds for lower rates.
In my view, I don’t think the Fed really knows. Just because inflation slowed doesn’t mean this is over. And remember how far behind the 8-ball the Fed was when all of this started.
Our Lean
We ran a poll in yesterday’s OP to get an idea of sentiment. So far, the outcome is pretty mixed and slightly favors the bear side of things.
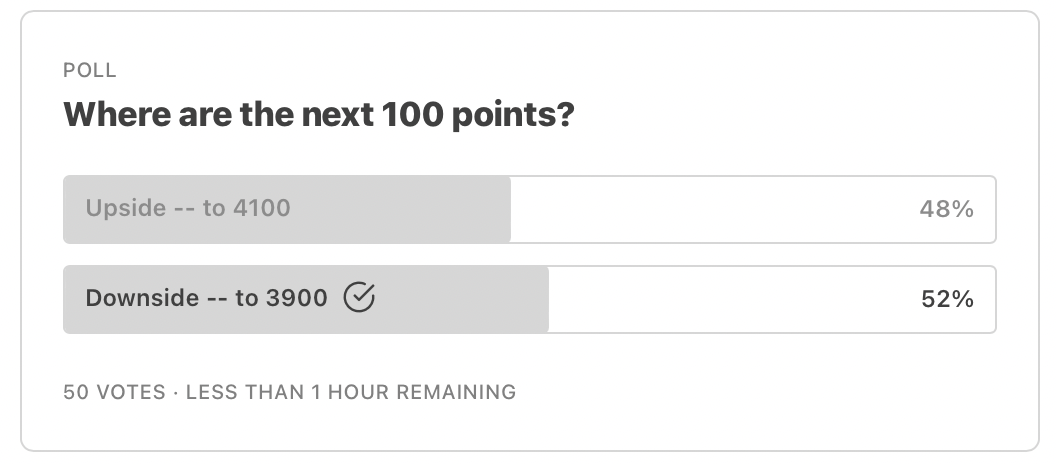
If the ES holds up, I think it could be headed to the 4100 to 4130 level. I also think it’s important not to forget how ALL the dead-cat bounces have ended up. You can sell the early rallies and buy the pullbacks or just be patient and buy the pullbacks.
If I’m right, 4080 could come fast. if I’m wrong, it’s back down to the 3950 to 3960 level. But before we get there, see if ~4015 and/or ~3990 act as support.
If the ES bids come flying in, it’s key for it to clear 4040, opening the door to 4050 and then 4080.
MiM and Daily Recap

The ES traded up to 4000 on Globex and opened Monday’s regular session at 3996.25 and quickly sold off down to 3986.25. After the drop, the ES rallied up to 4026 at 10:33. There was a big tech buy program that pushed the NQ up 1.6% in the first hour, and the ES gained 0.90% at its early high. After the high, the ES pulled back a few handles and rallied up to another new high at 4051 at 11:21, sold off down to 4033.50 at 12:11, and then rallied back up to 4047 at 1:03.
A sell program hit, pushing the ES down to 4016.75 at 2:54 and then rallied up to 4035.50 as the 3:50 cash imbalance showed $287 million to buy and traded 4036.50 on the 4:00 cash close. After 4:00, the ES sold back off down to 4031.50 and settled at 4037 on the 5:00 futures close, up 49 points or 1.23% on the day. The NQ closed up 258.5 points or 2.21% and all 11 sectors in the S&P closed higher.
In the end, it was a very broad rally filled with new buying, shorts covering and buy stops. In terms of the ES’s overall tone, the pullbacks were small until late in the day when the ES sold off 40 points from its high. In terms of the ES’s overall trade, it was roughly average, near 1.595 million contracts.
Technical Edge
- NYSE Breadth: 76% Upside Volume | (Nasdaq ~85% upside volume)
- Advance/Decline: 73% Advance
- VIX: ~$20
I found yesterday’s action quite tricky, as the S&P ramped higher through the morning, then dumped in the afternoon. While we did highlight some of the bigger weekly levels yesterday — like last week’s high, downtrend resistance, and the 50-week moving average — it was still a very bullish day until the afternoon.
On days where breadth is clocking in above 80%, I’m a buyer of the intraday pullbacks. That didn’t work out very well yesterday, but that’s why trading is a numbers game. If every pullback was a buy then there wouldn’t be any guesswork in this profession.
S&P 500 — ES

Same chart as yesterday. Notice how the ES has powered through that major downtrend mark. But also notice how it’s still struggling with the 50-week moving average. It’s back below last week’s high at the moment too.
I’m not saying the bulls have lost control. What I’m saying is, I feel like coming into Monday, many traders had ignored the bearish narrative because of Friday’s strong session.
It’s completely possible for the ES to maintain its upward trajectory.

If we zoom in a bit, the support levels I’m looking at include ~4015, which is the 10-ema on the 4H chart (right), as well as the afternoon low from yesterday.
Below that opens the door down the 3990 area, where we find the 200-SMA on the H1 chart (left) and a prior consolidation zone.
SPY
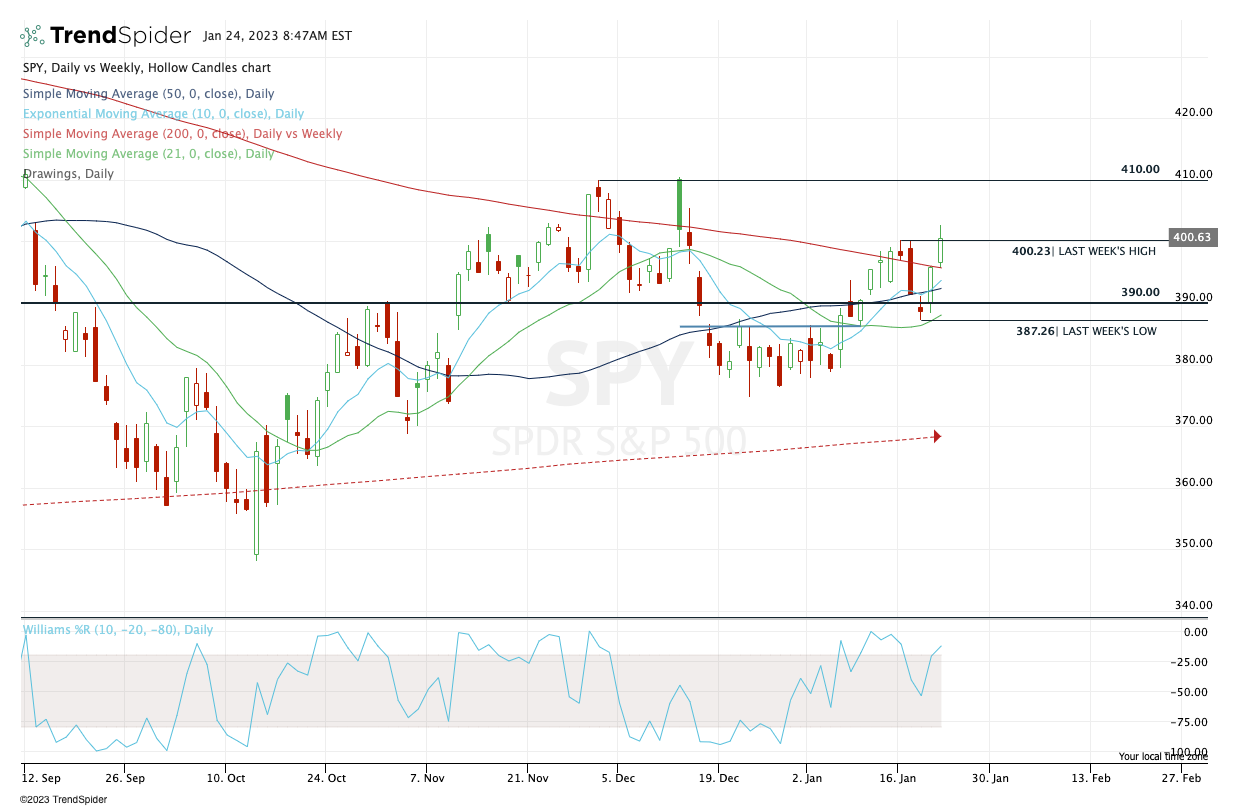
Bigger picture, $400 to $400.25 is the “line in the sand” on the upside. Over that opens the door to Monday’s high (and higher).
$395.50 to $396 is key on the downside. That’s the 200-day SMA, Friday’s high, and Monday’s low. A break of that area erases yesterday’s gains and opens the S&P up to more downside.
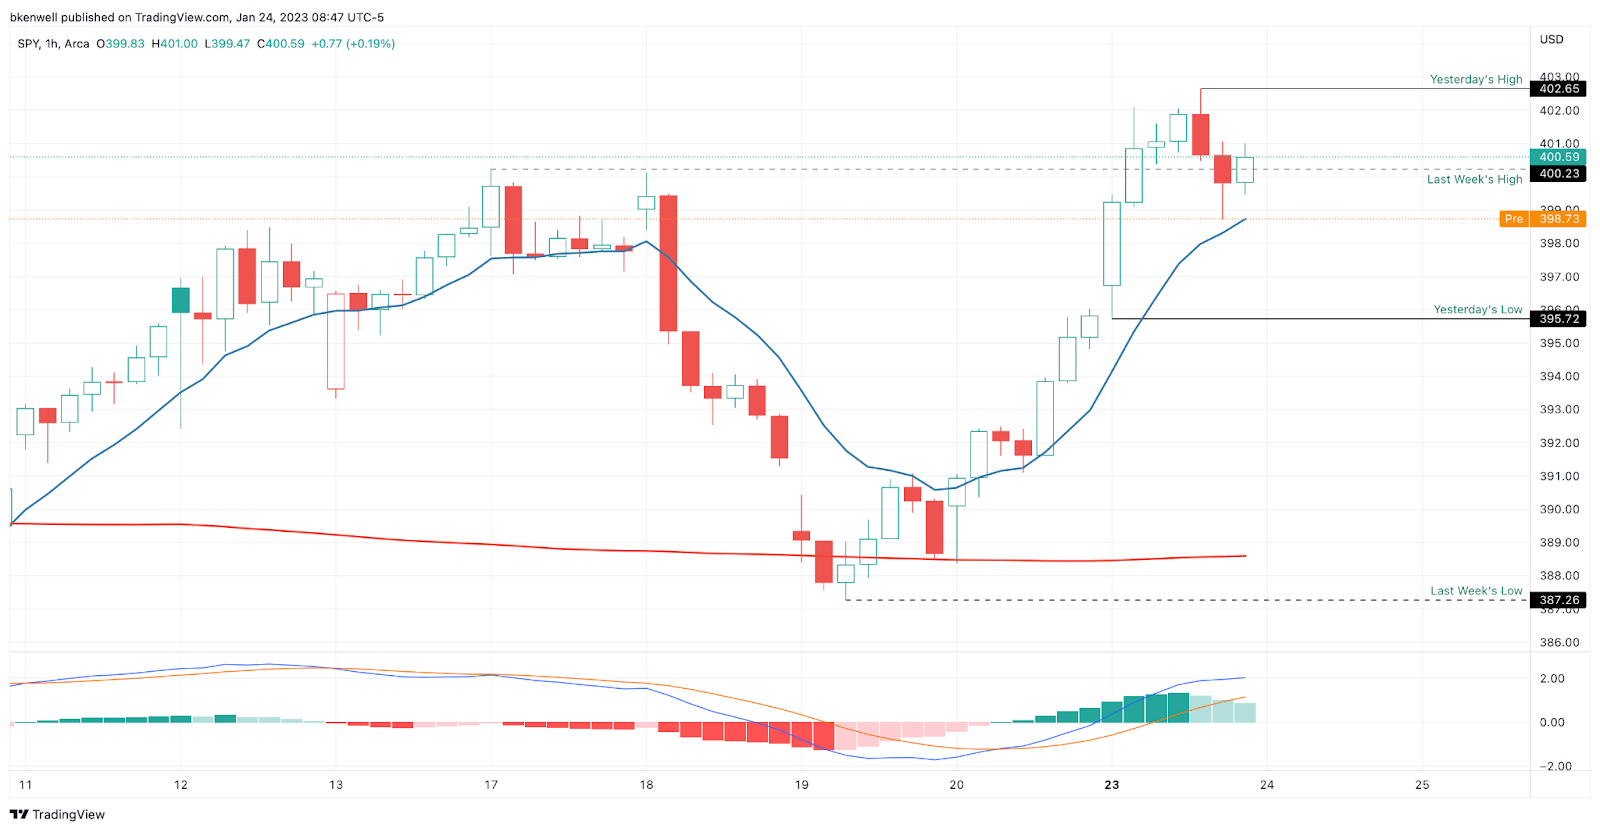
Zooming into the one-hour (H1) chart, if we open here, it will be very interesting action. It’s right at the 10-ema and the afternoon low.
A bounce from this level could put ~$400 back in play, even if it’s just for a trade. A break of $398.25 and failure to regain it opens the door back to back down to $397, then yesterday’s low.
Individual stock trades to come in a second piece.
Open Positions
A note: After talking to some members, I want to make the setups a bit more clear. We are a trade-ideas service, but want to make entries & exits simpler to understand. We will be sending more updates, a few educational pieces and looking for a way to make our setups more clear in how we are managing them.
- Numbered are the trades that are open.
- Bold are the trades with recent updates.
- Italics show means the trade is closed.
— Any positions that get down to ¼ or less (AKA runners) are removed from the list below and left up to you to manage. My only suggestion would be, B/E or better stops.
From this latest round, that includes TLT, DE and FSLR.
- COP — Long from $119, the 2x weekly-up. Trimmed ¼ at the 50-day. Still watching $123.50+ for the next trim. Can technically raise stops to $118-119 or B/E, (whichever suits your style better).
- MRK — Long from $108.75 — first target: $111 to $112.50. Stop at $106.75 to $107.
- NKE — Down to ⅓ or ½ after yesterday’s $128+ Trim. Looking for $130+ to exit more/all. B/E stop.
- GE — A lovely, textbook trade for us. A strong RS leader that pulled back into active support and bounced. Now down to ¼ or less and feel free to manage however you’d like as it rallies on earnings.
Go-To Watchlist
*Feel free to build your own trades off these relative strength leaders*
Relative strength leaders →
- SBUX
- TJX, ULTA, NKE
- CAT
- BA & Airlines — AAL, DAL, UAL
- GE
- CAH
- SMCI
- MRK — weekly
- FSLR
- XLE — XOM, CVX, COP, BP, EOG, PXD — (Weekly Charts)
Economic Calendar

Comments are closed