We may follow up after the report
Follow @MrTopStep and @BretKenwell on Twitter and please share if you find our work valuable.
Don’t Forget: The Long-term performance of the S&P 500, some longer-term setups, and 5 red flags that showed up before the 2022 bear market.
Our View
After back-to-back rallies, it was healthy for the market to take a pause on Monday. With this morning’s PPI numbers on tap, it made even more sense.
In yesterday’s OP, we noted several of the PitBull’s trading rules, the first of which says the ES tends to fail 20 points above a big figure a few times before it builds up enough momentum to push through. In this case, that was ES 4000.
Wouldn’t you know it, the ES ran to 4017.50 yesterday and then faded hard, falling more than 50 handles from the high.
The second rule is that the ES tends to rally early in the week during a bear market, which despite the recent price action, we’re still in. Third — and lastly — the future tends to get weak heading into the imbalance reading at 3:50.
Today we get a look at another set of inflation numbers with the PPI results. The market will be watching this closely (note: it was lower than expected and the market is rallying as a result).
With plenty of Fed speakers on tap this week, they will likely try to push their hawkish rhetoric — aka jawboning — even as the market is sensing a shift in policy.
Our Lean — Danny’s Take
The ES closed weak yesterday and has now made three consecutive daily attempts above 4000 if we include this morning’s sanction. So far, each rally is failing to stick.
While not as important the CPI number or the October jobs report, I continue to be a cautious bull going into today’s PPI number. However, yesterday’s weak close was not exactly a ringing endorsement for the bulls.
Further, we already know Fed Governor Christopher Waller has already dismissed the CPI number as just another data point that the markets have already gotten way in front of. And we also know from Powell’s comments during the last Fed meeting that we should expect rate hikes in December and into the new year.
Our Lean: Keep an eye on ~4020 on the upside. A strong move above 4020 puts 4060 in play. We will want to see how the dips are handled today.
On the downside, see how the ES handles the 40 to 50-handle pullbacks. Bulls want to see 3950 to 3960 continue acting as support.
MiM — Where’s The Money Going?
| Up | Down | Net Flow | |
| Last 20 Sessions | 16 | 4 | $18.2 Billion |
| Last 10 | 9 | 1 | $13.0 Billion |
| Last 5 | 4 | 1 | $7.2 Billion |
| Yesterday | Sell | $696 Million |
**Above is a table of the MIM data, which shows where the MOC money has been flowing over the past five days (week), the past 10 days (two weeks), and the past 20 days (past month). We are working on getting a chart up for this!**
Technical Edge
- NYSE Breadth: 31% Upside Volume
- Advance/Decline: 29% Advance
- VIX: ~$23.50
I am still watching the CAH setup, as well as the setup in the US dollar from yesterday.
S&P 500 — ES

I continue to like the idea of a dip back down to the 3900 to 3920 area — prior resistance — and a tag of the 10-day ema, but I’m not sure we will get it.
A sustained move over 4020 gets us to 4075 where we find the 200-day sma. Along the way, if upside breadth is clocking above 80%, I am a buyer on the dips (on the 15-min and 30-min charts at/near the 10-ema).
SPY — Daily
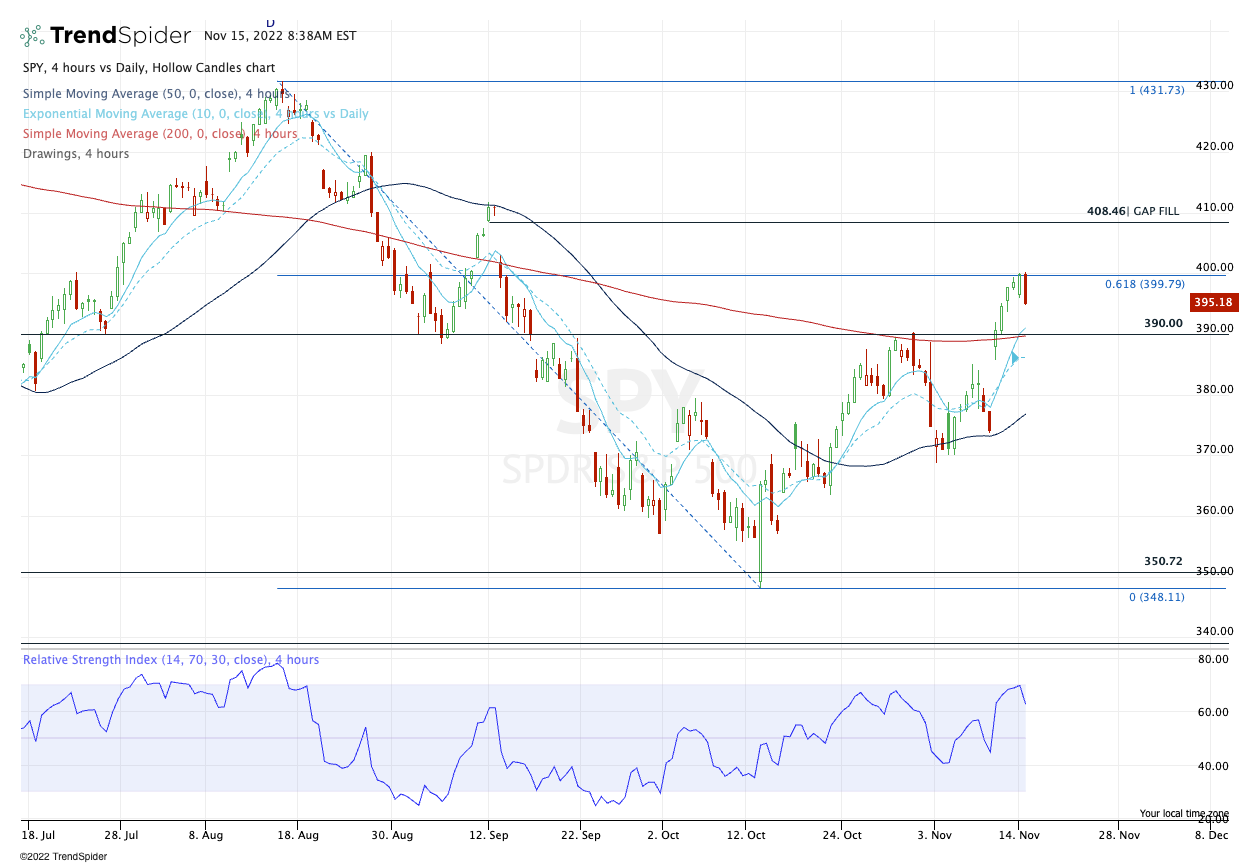
A 4H chart above, I would love for a dip to the $390 area on the SPY.
This morning, that’s where we’ll find the 10-ema and the 200-SMA, as well as a key pivot over the past several months.
On the upside, the SPY continues to struggle with $400 and the 61.8%. It needs to clear this area for a continued upside run. Above $400 opens the door to $408.50, where we find the gap-fill.
NQ — QQQ
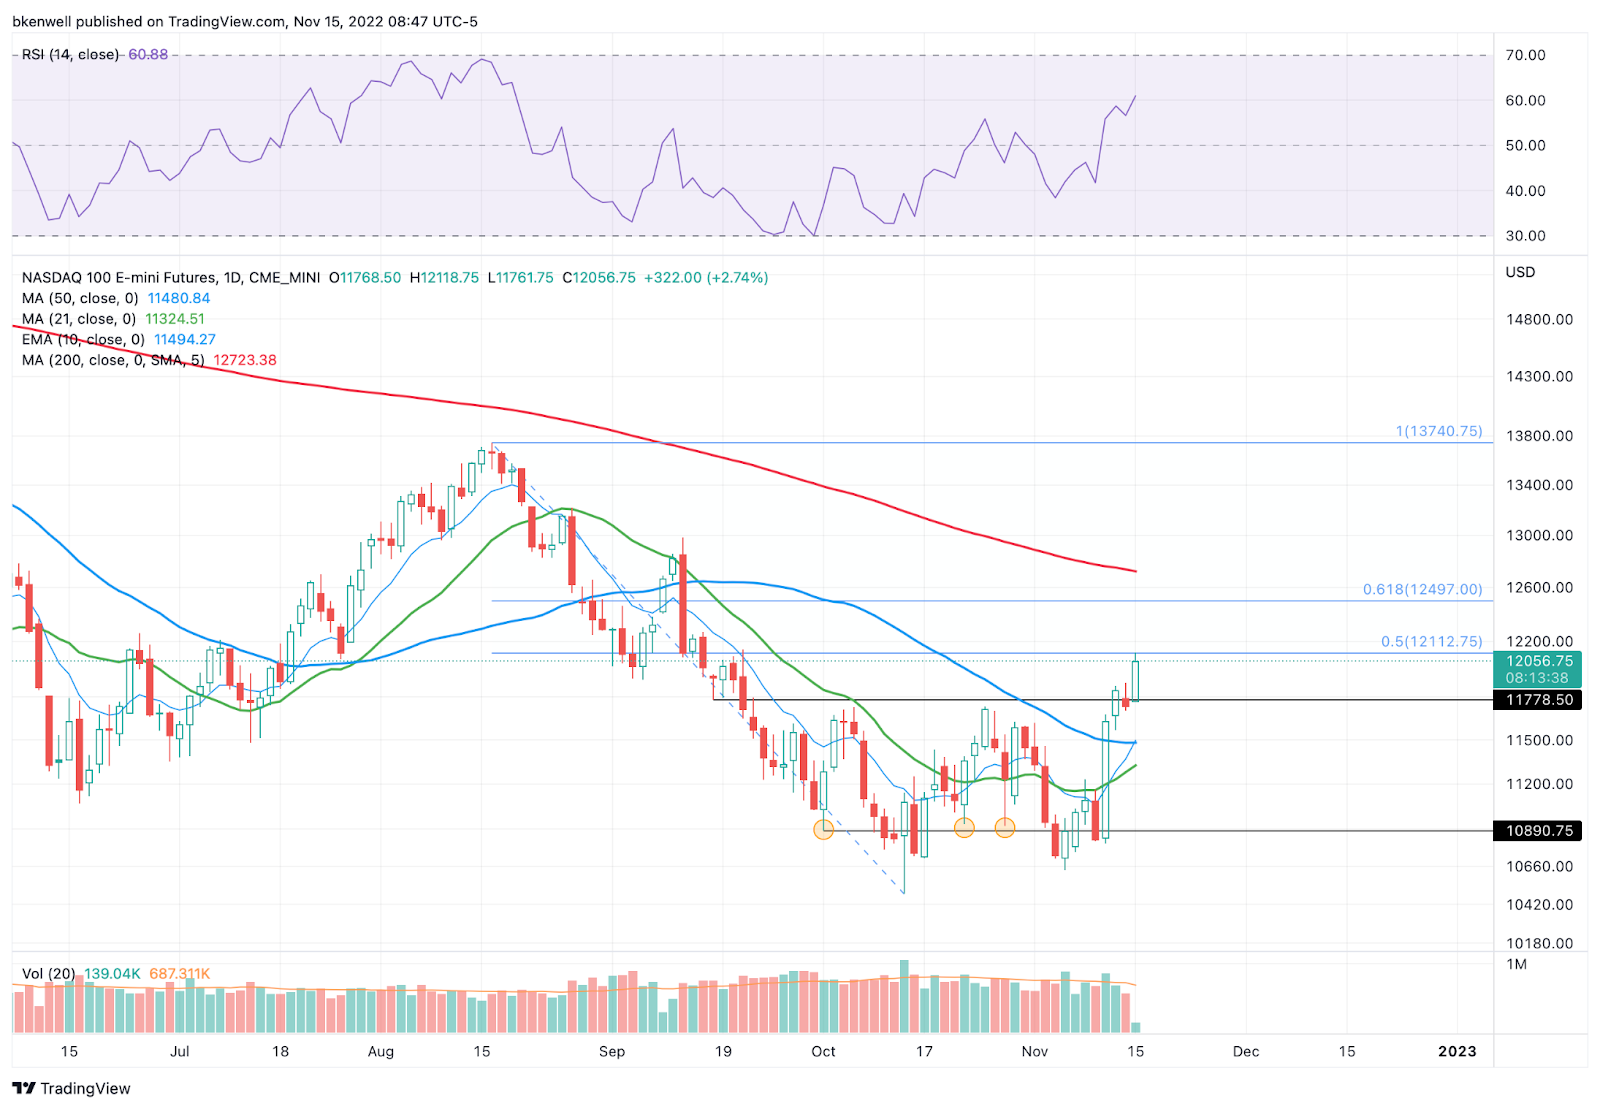
Up more than 300 points, the NQ is running right into the 50% retracement of the current range.
Like the ES — and you can include the QQQ — let’s see how the dips are handled today.
The NQ probably won’t see the 11,875 to 11,900 area today — the highs from the last two days — but if it does, that could be one area of support.
Go-To Watchlist
*Feel free to build your own trades off these relative strength leaders*
- Numbered are the trades that are open. g
- Bold are the trades with recent updates.
- Italics show means the trade is closed.
Open Positions
- MCD — Trim ¼ to ⅓ at $275-$276, ideally the latter. Can be down to ½ position if we see $278+. Can use $268 stop.
- Looking at a potential inside-and up day on Tuesday.
- TLT — I am long some TLT from ~$97.50 as flagged from Friday, but looking to fill out the position at/near $96.
- Aim to trim around $100.
- CCRN — Stop at $29.50 to $29.75 or B/E depending on your cost basis.
- Optional: Trim ¼ on any push over $32. Not optional: Trim at least ⅓ if we see $33 today.
Relative strength leaders →
Money rotated out of the winners and into beaten-down tech, as you can see many growth stocks roared Thursday and Friday.
- LNG
- CAH
- TJX
- CI
- AMGN
- CCRN
- GIS
- LPLA
- REGN
- ENPH, FSLR — solar has strength
- VRTX
- UNH
- MRK
- XLE — XOM, CVX, COP, BP, EOG, PXD
- NOC
Economic Calendar

Comments are closed