The S&P sits at a key weekly level this morning.
Follow @MrTopStep and @BretKenwell on Twitter and please share if you find our work valuable.
Don’t Forget: We recently noted the long-term performance of the S&P 500 (and what that means for investors and traders), and we also took a look at some longer-term setups for those interested.
I am going to ask Bret to open the OP to its full version.
For those of you that get the full edition, you know I tried and tried to warn people about September/October and its bad reputation. I have warned people about buying the dips, which doesn’t work in a bear market.
I’m not going to say that Warren Buffett’s buy-and-hold is dead, but I bet if you looked at the fund’s performance, it does better when rates and inflation are low. It’s funny. I told people over 6 months ago that the stock market acted poorly and that everything felt disjointed. Remember when rates were low and how the markets would take bad news and make good of it? We would joke about how the PPT — the Plunge Protection Team — would save the markets when they sold off.
Those days are gone and are not coming back for a long time. I know my end-of-2022 prediction was for a bounce and I think if it’s timed right it could be a profitable trade. However, I am starting to think we have lower prices again in 2023.
This week there is more Fed speak, OPEC meetings to drive oil prices higher, third-quarter earnings soon, and Friday’s September jobs report. Looking forward, the Fed still plans to raise interest rates by 1% to 1.25% by the end of the year.
For the first time since the 2008 credit crisis, the S&P 500 and Nasdaq Composite closed out a three-quarter losing streak. According to Charlie Bilello, at 269 days and counting, the benchmark S&P 500 is now in its longest peak to trough correction since March 2009. The current 8-month bear market is the longest since the 2007-2009 downturn, while the average length of a bear market stands at 14 months since 1929.
Our View
I would think it would be higher, but a survey by the American Association of Individual Investors (AAII) showed that 60% of retail investors hold a bearish view of the stock market, the highest level since 2008 and the eighth most pessimistic reading in the 35 years that the survey has been conducted.
With short ES open interest near a record level, it doesn’t seem to matter how oversold the markets are right now. The overall negative tone has been all-encompassing and has little sign that a big bounce is coming.
According to the Stock Trader’s Almanac, October is known as the ‘jinx month’ because of crashes in 1929 and 1987, the 554-point drop on October 27, 1997, the massacres in 1987 and 1989, Friday the 13th in 1989, and the credit crisis ‘meltdown.’
But — and there is always a but in October — it’s also known as the BEAR KILLER as October has turned the tide in 12 post-WWII bear markets: 1946, 1957, 1960, 1962, 1966, 1974, 1987, 1990, 1998, 2001, 2002 and 2011. Seven of those years (7/12) were midterm years as well, like this year.
October also ends the worst 6 months for stocks and seasonally, November/December tends to be the strongest two-month stretch for stocks.
So as bad as things are, there is hope.
Our Lean — Danny’s Take
According to the Stock Trader’s Almanac, the first trading day of October has the Dow down 9 out of the last 16 years (56%).
There are lots of moving parts this week. Our lean is that we “cannot rule out a bounce,” but we think it will be sold.
For the SPX, 3505 is the 50% retracement from the all-time high down to the March 2020 low. In the ES, that retracement is 3491. I know a lot of people think we could see this retracement today, but I’m not so sure about that.
On the upside, my levels of interest are: 3635 to 3640, 3658, 3680.
It’s going to be an interesting week.
Daily Recap
I’m not going to be doing the normal recap today. The ES traded down to 3640.25 and opened Friday’s day session at 3644. After the open, the ES sold off down to 3626.50 at 9:40 and rallied almost 60 points up to 3684.50. After the high, the ES dropped 40 points over the next 70 minutes down to 3643, and over the next half hour, it rallied back up to 3659 at 12:45 and spent the rest of the day selling down to 3595.25 on the 4:00 cash close after the MIM showed over $6 billion to sell. After 4:00, the ES rallied from 3595 up to 3612.50 and settled at 3605 on the 5:00 futures close, down 52.75 points or -1.44% on the day.
In the end, it was a bloodbath as the institutions sold stocks at the end of the quarter and the JPM Collar trade totally demolished the S&P. In terms of the ES’s overall tone, it didn’t matter if it was a 5-point pop or 30 everyone was a ‘dead cat.’ In terms of the ES’s overall trade, volume stayed high all week and Friday’s total volume came in at 2.82 million contracts.
- Daily Range: 98.50 points
- High: 3693.75
- Low: 3595.25
Technical Edge
- NYSE Breadth: 16% Upside Volume (!)
- NASDAQ Breadth: 16% Upside Volume (!)
- VIX: ~$31.50
Game Plan: S&P, Nasdaq
Traders are increasingly looking for a bottom. The Fed is hawkish and the PCE inflation reading came in hot last week. It’s my view that the market could or would start to look past these things after it made new lows and tested into some of the key areas we laid out in September.
However, we now have a growing fear that “something is breaking.”
The fingers point back to Credit Suisse, although the market doesn’t seem all that worried about it as of 8 a.m. ET. My concern is the volatility we’re seeing in the currencies and bonds — two normally quiet and calm areas of the market.
Volatility in those areas — alongside a rising rate environment — has the potential to cause some damage. Last week, the UK almost had its “Lehman moment.” Now the weekend chatter is Credit Suisse.
Whether or not it comes to fruition, these are not positive conversations to be having!
You all know how I feel about an up-open in a bear tape. Even though bonds are rallying, so is the dollar. As it pertains to the S&P 500, we closed near the lows last week and on Friday, but it was the end-of-quarter. So there are some messy cross-currents to wade through.
SPY

In our last video from Sept. 15, we talked about the SPY breaking uptrend support and the increasing likelihood that it would break to new lows and test the 200-week moving average. We’re finally seeing that play out, alongside the fifth wave down to the E leg of the ABCDE pattern.
Now we need to see if the 200-week moving average is enough of a support level to send the SPY higher for more than just a few hours.
If we bounce, I think it’s fair to wonder whether we can reclaim the prior June low near $362. There’s a lot of supply between $362 and $364, as evidenced by the daily chart below:

If this thing really gains steam in the next day or two, I think ~$370 and the 10-day is a rally to sell.
Otherwise, $362 to $364 could be a solid resistance area for now.
S&P Futures — ES
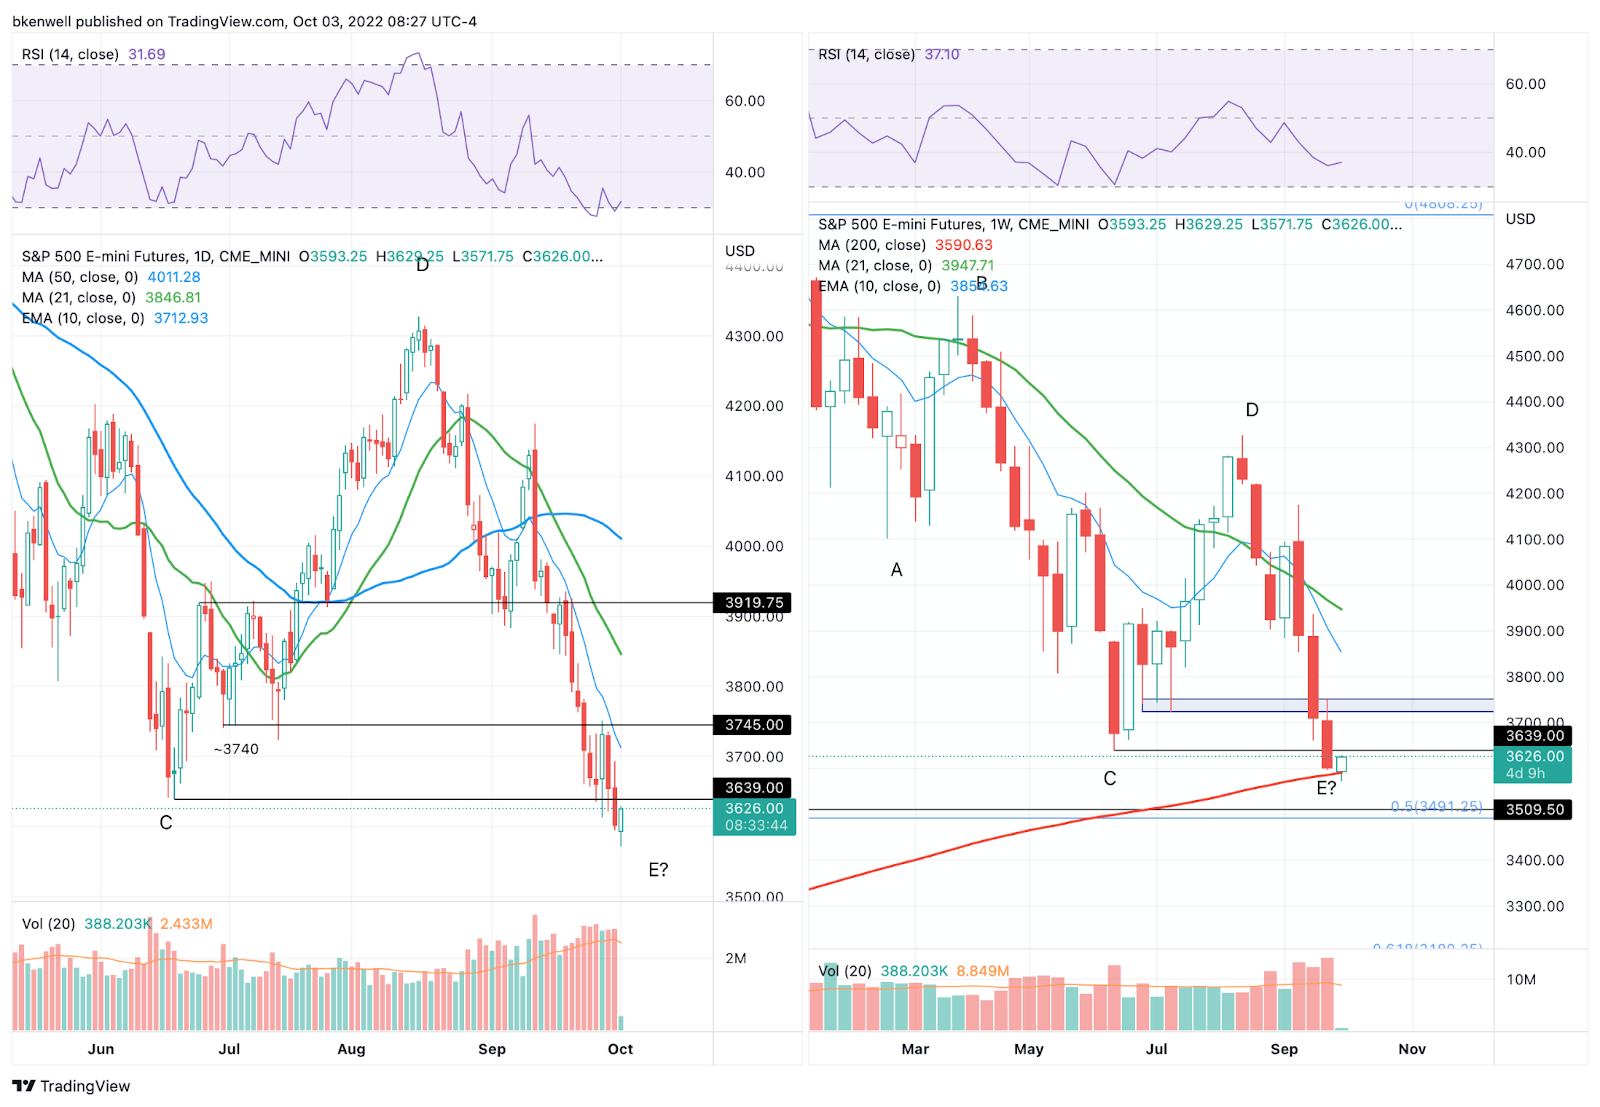
Daily on the left, weekly on the right and you can see that the ES is bouncing off the 200-week moving average as well.
The ES had a break of Friday’s low and reclaimed it during Globex for a good cash flow reversal trade on the long side. Now coming into the day with a higher open is tough.
How it handles the June low will be interesting near 3639. Really, between 3640 and 3660 is a lot of supply. If the ES can reclaim it, then 3700 and the declining 10-day are in play.
Like the SPY, I would consider that move to be a sell.
While the markets are oversold and pessimistic, the trend has been to the downside. I wouldn’t blame someone for selling an opening push into the 3650 area +/- 10 handles, given the “higher open in a bear tape” and a key prior support zone that failed on Friday.
ES — The Trade
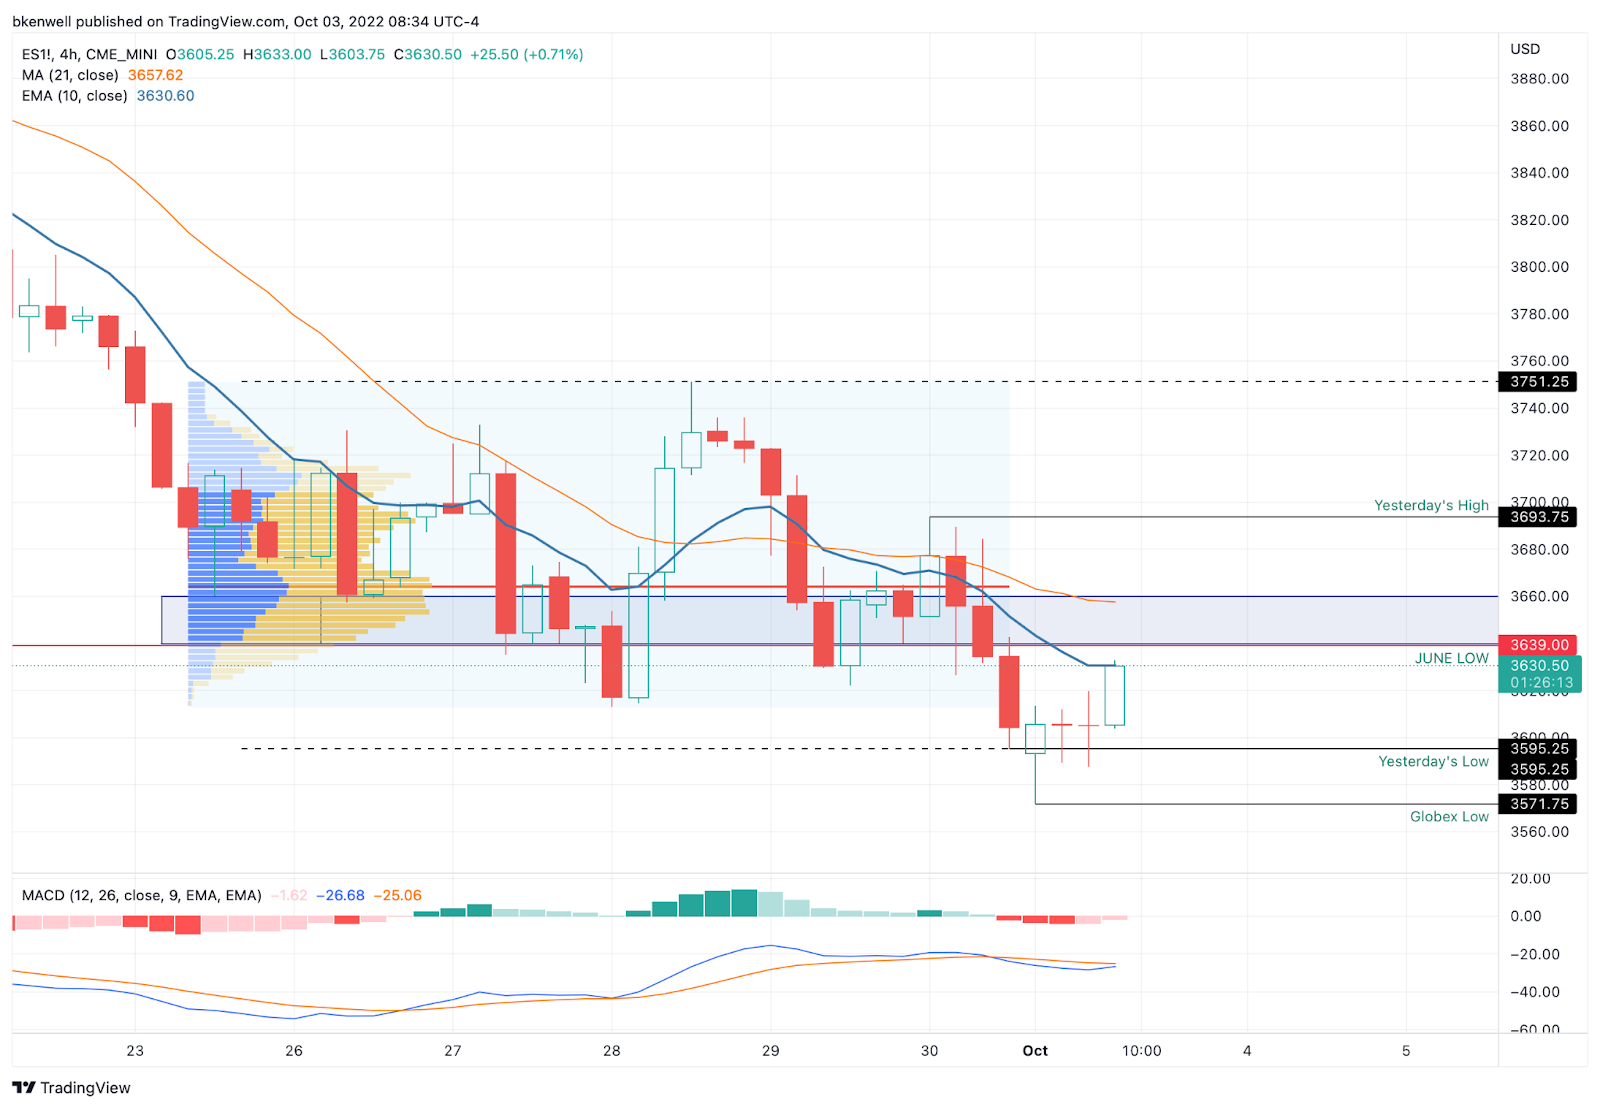
Above is the 4H chart of the ES, with a volume profile going back to Friday, Sept. 23, and covering 1 week of action.
It shows the volume build in the 3640 to 3660 region, mostly favoring the latter part of that range. Then an air pocket until ~3700.
Some speculators may prefer to sell the ES as it tests into the declining 10-ema, but as you can see on the chart above, that hasn’t exactly been active resistance on each test. Maybe it is this time, and if so, we have a high to measure against, but I prefer seeing if we can get a little better R/R.
Nasdaq — NQ

I don’t know why I always write so much about the ES but keep the NQ simple, but it has worked so we’re not going to fix it.
We must see how the NQ handles the 2022 low at 11,068.50 and Friday’s low at 11,024. That’s a somewhat wide 44-point range, but in this tape, it’s not much at all.
If the NQ can hold above this level, it opens the door up to the 11,225 area, +/- 25 points.
If it can’t stay above it, then the Globex low remains vulnerable down at 11,890.
The Dollar — DXY

Some prefer the DXY, while others prefer the UUP. Both are fine. Trade this if you want or just use it for an observation for stocks. A higher dollar is a net negative for equities.
It has pulled back into active support via the 10-day moving average (shown on the left).
This area may support the dollar and if so, 114.50+ could be back in play if it continues to rally.
However, if it fails, the DXY may need a larger pullback to the 109 to 110 area. That would get it to the 50-day moving average and the 10-week moving average (the latter shown on the right).
Notice that these measures have been strong support.
So short-term buyers may consider a long if the DXY can clear Friday’s high and stay above it. That would be bad for stocks, most likely. Otherwise, they may prefer to wait for stronger support. Either way, the dollar is in an uptrend at the moment.
*Feel free to build your own trades off these relative strength leaders*
- Numbered are the ones I’m watching most closely.
- Bold are the trades with recent updates.
- Italics show means the trade is closed.
Notes:
Relative strength leaders →
Top:
- ENPH — holding the breakout near $269
- LNG — nearing the breakout near $150 — Monster Reaction
- MCK — holding the breakout near $340
- CAH — holding the breakout near $64
Here’s a quick look at the stocks above (in the Opening Print Twitter Community).
- FSLR
- ALB
- VRTX
- CYTK
- PWR
- CHNG — robust
- CELH
Economic Calendar

Comments are closed