Our View
What are the driving forces pushing the markets down? Inflation and supply chain issues is my guess. It’s also had the Covid-19 blues since the news broke about the new Omicron variant. We know the Fed is out of sync, which I think makes it more unlikely that they say anything major in front of the Christmas holiday and the end of the year.
I think we all know this isn’t an easy game right now.
There are some big gains and losses in the middle of all this thrashing. I was talking to the PitBull when the ES sold off down to 4598 and while we were on the phone, it rallied 14 points in a matter of minutes.
That’s how this works right now. You put your guard down or do something stupid and you get smoked — fast. That’s why it’s OK to cut back and be patient. It’s very possible the ES falls again today, but that will set up the Thursday buy for Friday’s December quad-witching expiration.
I think it’s really important to trade smart going into the end of the year. For me, that means less day trading and finding my spot to get long going into the end of the year.
Over a month ago I was saying to get long the Dow into the end of the year, so I will be looking at that. In addition to my long January calls, I may add some micro ES and YMs futures, but that will be geared toward the Santa Claus rally or the last 5 sessions of the year. I already have part of my long with the 4850 and 4900 January calls, so I guess the question comes down to this: With 12 sessions left in the year, is it time to load up or be patient?
Our Lean
I traded well yesterday, particularly in the first 90 minutes of the day. Then I got up and walked away before coming back for the last 2 hours.
We see a lot of “boredom trading” — something I can be guilty of too — and that needs to be avoided. Especially right now. I have seen guys blow up in the last few weeks of the year and that’s not how we are going to bring in 2022.
While I am bullish, the current price action includes big 100 to 150 handle head fakes. One day the bulls are the king of the hill and the next day they’re in the shitter. Look, I could be 100% wrong, but I think all the thrashing will lead to a low, followed by a big rip (which is generally best initiated when the futures are tanking).
If the ES gaps higher today, I think you sell it or sell the 30+ handle rallies. If the futures are weak at the end of today, I may add some calls but I am going slow. I just don’t think all the big rips and dips are over!
S&P 500 Recap
Monday was a tough session and Tuesday didn’t come easy either. In the 4:30 am 30-minute window, we saw the ES fall more than 25 points. After a mild rally, the ES fell another 30 handles down to 4625 where it opened the regular-hours trading session at 9:30 am.
From there, it rallied up to 4652 and then sold off down to 4638 at 9:54. After the drop, the ES rallied back up to 4647.75 — a lower high — then trickled back down to the 4625.50 level at 10:20.
After the pullback, the ES chopped around before dropping down to new lows at 4605.50, down 19 points from the open and 71 points off the Globex high.
The ES rallied up to 4615.75, but then got hit by another sell program that pushed the futures down to 4601 going into 12:00. After another mild rally, the ES broke down to the 4598 level, then eventually broke down to the session low of 4696.25 at 12:48.
From the low to 2:00 pm, the ES mostly chopped in a 10-point range between 4598 and 4608, until it quickly rallied 17.50 points up to 4616 at 2:13 and then up to 4620 just before 3:00. From there, the ES started to run the buy stops all the way up to 4630.50 at 3:00, pulled back under the VWAP at 4624.50, and rallied right back up to the 4630 level.
That was followed by another big stop run up to 4638.50 as the early MIM showed $255 million to buy at 3:37. The ES traded 4624 as the 3:50 cash imbalance showed $221 million to buy. The ES dipped down to 4618 before bouncing back up to 4627 on the 4:00 cash close. The ES settled at 4629.25 on the 5:00 futures close, down 34 points or 0.73% on the day.
In the End
In the end, it was a bad day for the futures. In the first half-hour, the YM rallied 275 points, then it broke lower by 400 points. The NQ fell 398 points from its high to the low, while the ES fell 86 points.
In terms of the ES’s overall tone, it was weak early and firm late. The ES was lower in the first three hours, flat in the fourth hour, and rallied in the final three hours. In terms of the ES’s overall trade, volume was higher at 2.2 million contracts traded, but it was not as large as one might think based on the action.
As we all know, there’s no crystal ball when it comes to trading stocks, options, or futures. But the Market Imbalance Meter may be as close as it comes. Knowing how the “Big Money” is placing its bets can give our trading room a big wave to ride — or a warning sign to stay out of the water. Come check it out now, risk-free for 30 days.
Technical Breakdown
- NYSE Breadth: 63% downside volume
- NASDAQ Breadth: 67.6% downside volume
There’s a huge push-pull going on here. On the one hand, we had that powerful rally last week, followed by some healthy consolidation as the technicals favored the longs. However, we also knew that a “less is more” approach this week would be critical, given the events on the table.
In other words, we want to be long but the action is making it difficult.
Today we get the Fed, with the odds favoring no hike. If the Fed were to deviate from that plan, it would create some obvious havoc. As mentioned previously, we also have quad-witch expiration in a few days.
Once we clear that though, could we have smooth sailing for the end-of-the-year trade? That is my (and other traders’) hope!

The Game Plan
“We’re not going to go crazy here. Why do something stupid and get chopped up in this pre-holiday mess until we have some clarity?”
That was yesterday and we are sticking to our guns — especially ahead of the Fed. Luckily, we aren’t a trading service or alert service. We don’t have to trade each day or force ourselves into poor setups.
It is perfectly fine to ride the bench for a few days and wait for more clarity and better setups. That’s exactly what we’re doing now. Why ruin a potentially good couple weeks by forcing our trades on a couple of bad days.
It’s no surprise that we can have 10 good trades and they get completely wiped out by 2 or 3 bad ones. This is the same thing.
Remember this: As for yesterday, I will only note that around noon, breadth was surprisingly strong as the S&P and Nasdaq were at their lows. The VIX was only at $22-and-change too. That can be a good time to look for long setups, when the internals aren’t adding up to the current headline results.
In this case, the internals were much better than the decline suggested.
S&P 500
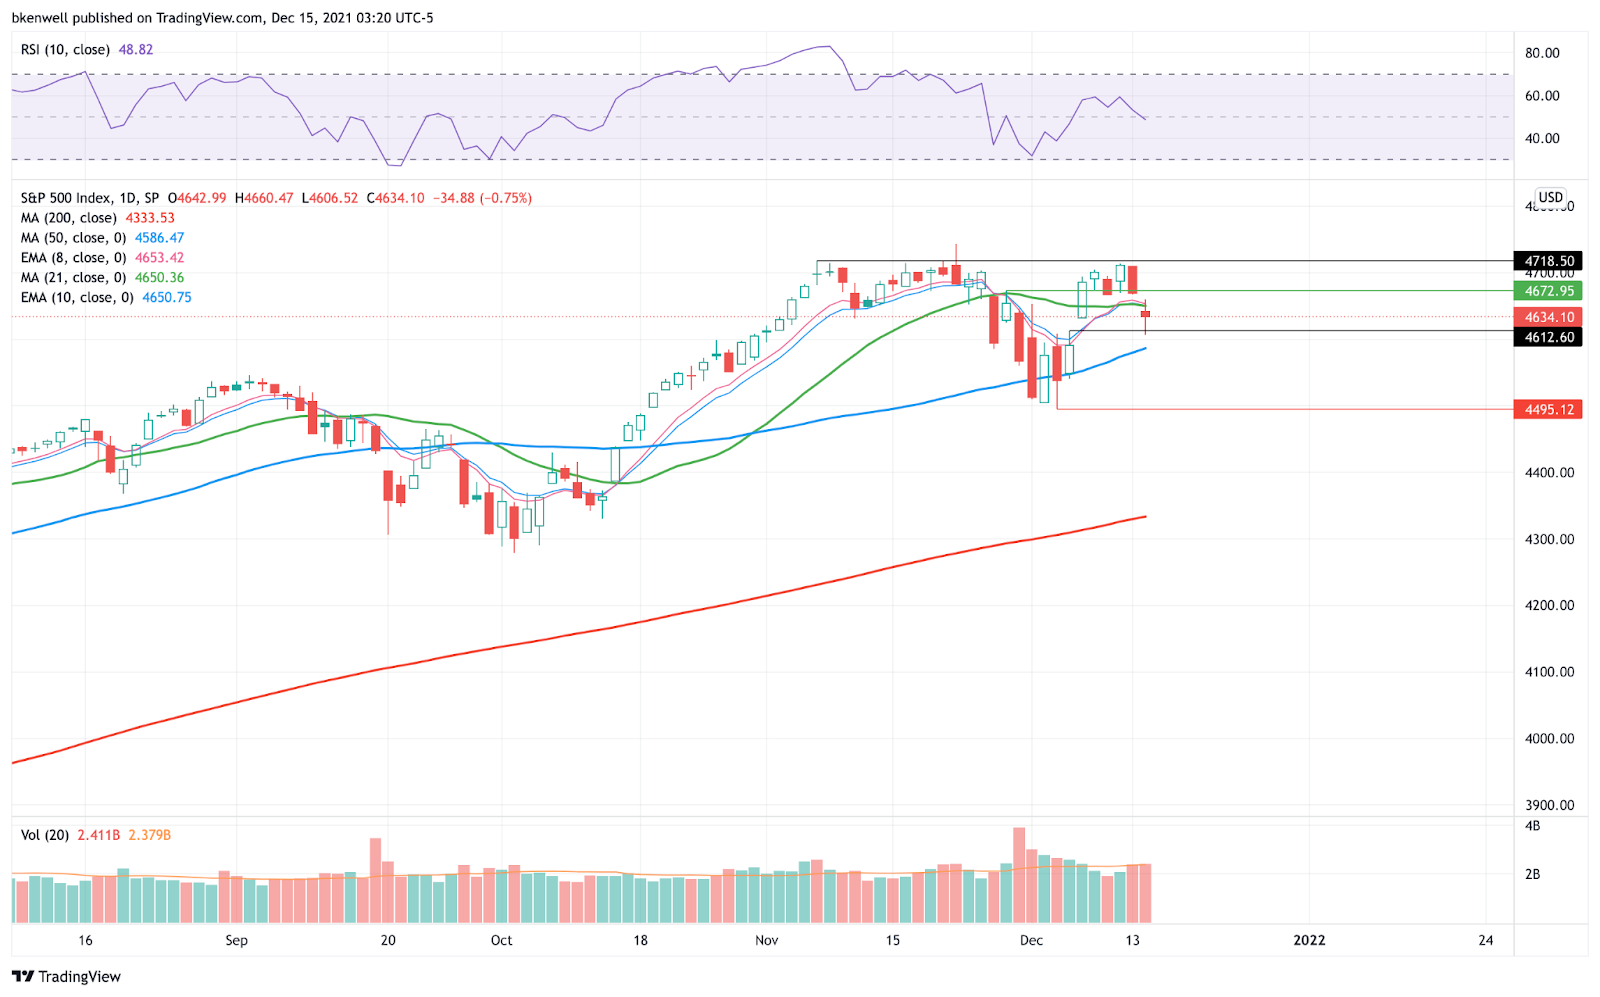
Officially filled the gap at ~4612, but is below the 10-day and 21-day moving averages. If the SPX can reclaim these marks, 4673+ is in play.
Below Tuesday’s low and the 50-day is on deck. With the Fed due up, I wouldn’t be surprised if this measure is tested at some point today, either ahead of the announcement or after the 2pm headlines start flying.
Nasdaq
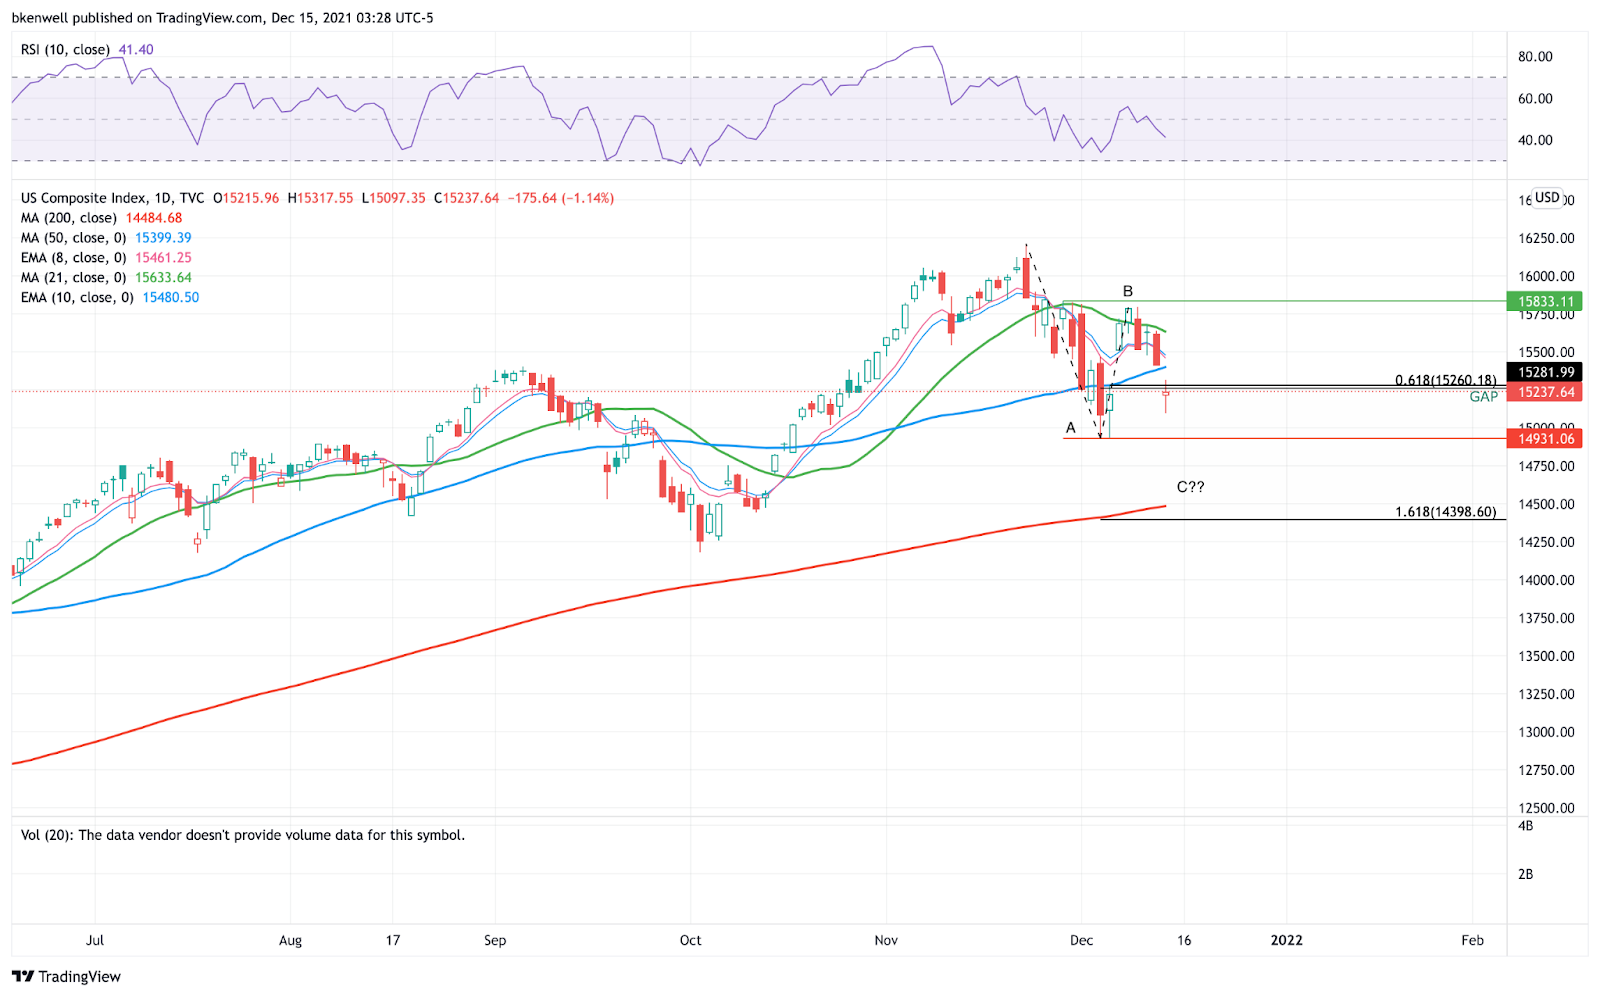
We also got the gap-fill in the Nasdaq. While it’s not the route I expected at the beginning of the week, it was a possible outcome in the game plan.
Now the question is, what does it do from here?
Do we rotate back up after a “job well done” on the gap fill, or is the Nasdaq in an “ABC” correction? If it’s the latter, we at least have to account for a potential test of the 14,930 lows and potentially need to plan for a larger break to the downside.
All I have to say for that is, if we do have a breakdown — say to the 200-day — growth stocks are going to get slugged.
Dow

To me the Dow actually looks the healthiest of them all. It continues to hold the 10-day, 21-day and 50-day moving averages and a rotation over Tuesday’s high could yield a move up to 35,950+
On the downside, a close below Tuesday’s low could create further downside pressure.
Russell

The least impressive of them all is the Russell 2000.
Hammered in the last four trading sessions, the 2,147 lows may be back in play shortly. While this area has been long-term range support (as shown on the weekly chart on the right), there are some disturbing observations here.
There’s the failed breakout in early November, followed by the break of the 50-week moving average and failure to reclaim this measure as it acted as resistance.
If it can find its footing, 2,250 may be back in play. Otherwise, we have to be careful if this one breaks 2,100.
Individual Stocks
I am still keeping an eye on Relative Strength leader PG, but I am starting to watch a few growth stocks in the mix (charts in the link).
- NVDA is at the 50-day.
- NET is at the 10-month moving average and the 161.8% downside extension.
- UPST gap fill and some divergence.
- AAPL resetting nicely to the 8/10-day moving averages.
Disclaimer: Charts and analyses are for discussion and education purposes only. I am not a financial advisor, do not give financial advice, and am not recommending the buying or selling of any security.
Remember: Not all setups will trigger. Not all setups will be profitable. Not all setups should be taken. These are simply the setups that I have put together for years on my own and what I watch as part of my own “game plan” coming into each day. Good luck!
Economic Outlook

Comments are closed