Our View
Are the lows in? My bull side says buy every pullback going forward, but my street smarts say there are 284 days left in 2022 and that anything can happen. And if the markets do continue to short cover, they will do it in the face of large economic and geopolitical uncertainties. I think the current times are the most uncertain in my life. That said, life is about making adjustments, which is something I know a lot about.
Not very many guys with a high school education have seen as much financial carnage as I have. I saw firsthand the demise of Bear Stearns, Lehman, and AIG, along with countless hedge funds and bank trading losses. Subprime was the kickoff party to the end of Wall Street.
I always said that there was a big party on Wall Street and we were not invited to it, but we had to pay for it and now the US is caught up in the highest inflation in 40 years alongside rising rates and the end of quantitative easing.
I don’t know if I’m going to be right or not, but I still think we bottom in early Q3, potentially fade again in October and then rally into the end of the year. That said, no one knows for sure what the stock market is going to do next — if they say they do know, they’re full of you know what — so let’s take it one day at a time.
Our Lean
From last week’s low to Monday’s high, the ES rallied almost 350 points. The Fed finally got its 1/4 point rate hike, while the Ukraine war story could change at any second. President Putin is turning up the heat on President Biden for calling his actions in Ukraine “war crimes,” saying Russia could sever ties with the US.
President Biden travels to Brussels to participate in a NATO summit on March 24 and will also join a European Council meeting. This is dangerous stuff and any escalation would be a major turning point for the stock market.
Based on yesterday’s close, I would expect the ES to pull back on Globex. The last few days, the ES rallied near the open and then sold off and made an early low.
As a result, Our Lean is to sell the rallies and look for a low or bounce going into the 10:30 to 11:00 ET time frame. Since the start of the rally, the ES has either bottomed in this range or later in the afternoon, in the 2:00 to 2:30 range. In that case, we’ll keep our eye out for something similar tomorrow.
The last time we had a four-day rally, the Nasdaq dropped 2200 points in the next 16 trading days! If the situation escalates in Eastern Europe — and especially between Russia and the US — we could certainly see more selling. I’m not saying this is going to happen, but how far can NATO and the EU push before Putin bites back? It’s a bad situation all the way around.
Daily Recap
The ES traded down to 4430.75 on Globex and opened Monday’s regular session at 4452 and shot up to 4473 at 9:40 and traded down to 4335.50. After the low, the ES rallied 30 points up to 4465.50 at 11:21 and then dropped ~15 points down to 4450 at 11:50.
We traded 4467 at 12:31 and dropped almost 30 points down to 4435 at 1:37 after the Powell headlines hit. After the drop, the ES rallied back up to the VWAP at 4451.50, then dropped down to 4315 at 1:23.
After the low, the ES chopped a bit, then got hit by a buy program/upside stop run up to 4448.50 at 2:52. After the pop, the ES sold off down to 4425.50 and rallied up to 4442.25 as the early MIM showed $305 million to sell. From there, it traded down to 4429.25 as the 3:50 cash imbalances showed $1 billion to buy and roared up to 4456.75.
The ES traded 4453 on the 4:00 cash close and settled at 4458.50 on the 5:00 futures close, roughly flat on the day. It was one of the lowest trading ranges we’ve seen in a while
In the end, it was all about the Nasdaq. In terms of the ES’s overall tone, it was totally supported by the NQ. In terms of the ES’s overall trade, volume was low in the early parts of the day and picked up slightly on the selloff, but overall it remained low at 1.32 million contracts traded.
- Range: 58 points
- H: 4473
- L: 4415
Technical Edge
- NYSE Breadth: 47% Upside Volume
- NASDAQ Breadth: 49% Upside Volume
We did not get the breadth reading we needed today for a significant upside breadth stretch (of five days). In a way, I’m glad. It would have further complicated things and left a muddier view.
That said, the reality is we had a pretty powerful four-day rally and even Monday’s mild dip did little damage given the five-day performance. However, we’re now talking about five days as if the last five weeks haven’t been a near disaster for the bulls.
Without enough evidence in the bulls’ pocket, I think it’s too early to completely rule out that the correction is completely over. There are still issues, the main of which are: Ukraine-Russia, inflation, and Fed tightening (but at least we have clarity with the last one!)
Game Plan
For the first time in almost a week, we had a rather chill day. I will default to Monday morning’s video with most of our approaches, but touch on a few key areas below, starting with the S&P.
S&P 500 — ES

On the upside, keep an eye on the 4466 area — last week’s high — and the 200-day. A strong push above that could open the door to the 4540 to 4580 zone.
On the downside, losing Monday’s low at 4415 and the 50-day could put 4400 and the 10-day in play. Below both measures and the 21-day is on tap.
Nasdaq — QQQ
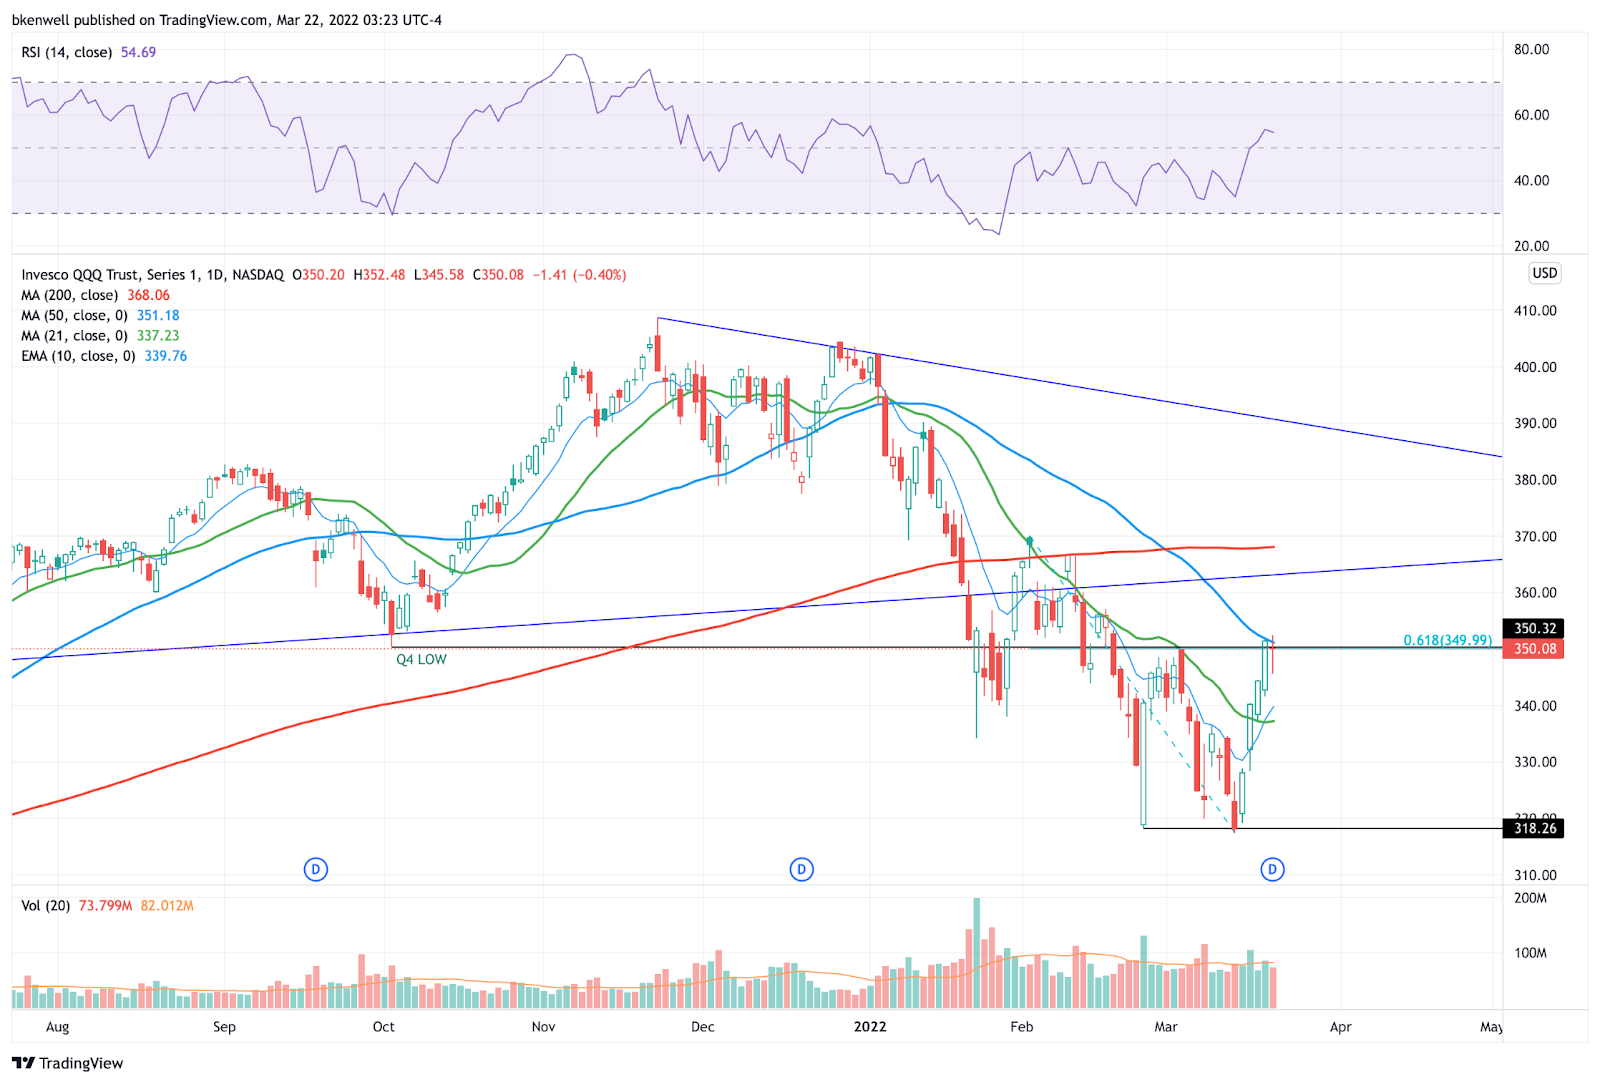
A similar setup on both the NQ and the QQQ, it’s still into the four major levels noted in the video. Let’s see how it resolves from there. Over Monday’s high and the 50-day can allow tech to press higher.
Below Monday’s low and I think we need to think about a potential test of the 10-day and 21-day MAs.
Crude Oil
As discussed in the weekend video, CL continues to pressure higher and now the $115 to $116 area is in play.

Nike

Nike is trading $137-and-change in the after-hours following its earnings report. Let’s see how it handles the declining 10-week ema and the $139.50 area. The latter is prior support that failed in February, while the declining 50-day comes into play near that mark as well.
Keep an eye on this for a possible fade.
Above $140 and the mid-$140s are on the table.
PANW

Nice relative strength lately. Let’s see if PANW can give us a 2x daily-up over $578.25. Nearly an inside day on Monday.
Go-To Watch List
*Feel free to build your own trades off these relative strength leaders*
Numbered are the ones I’m watching most closely. Please look at these closely.
- BMY — Trimmed ⅓ to ½ here. Look for $73.50 to $75 next.
- BRK.B — Hit $342 trim spot. Trimmed another ⅓ at $350 — down to runners but no problem with cashing out completely here and look for a BTD opportunity.
- VRTX — Trimmed ⅓ at/near $250. $254-$255 next trim spot (small).
- COST — Boom! Trimmed ½ at $565.
- TECK
- TU
- MKC — Watching $99+ (weekly-up rotation)
- CCK
- Energy —XLE, APA, CNQ, CVX, ENB, PXD — robust strength
- ABBV
- ADM
- CHKP
- AR
- DLTR
Economic Outlook

Comments are closed