Our View
Everything feels so fragile. The ES rallies almost 200 points and then falls 110 points in less than 24 hours. The sell-off was 100% tech weakness after SNAP ‘snapped’ and took down Meta, Alphabet, Roku, Facebook, Twitter, The Trade Desk, and more.
I told the PitBull that we should expect more Snap-type warnings in the future.
The NQ is on pace for one of its worst starts to the year — ever. I’ve never watched the Nasdaq futures as much as I have over the last 4 months. After the ES rallies 40 to 70 points, I stare at the NQ imbalances because that is usually where the selling shows up first. I know the bulls are circling the ES/NQ bandwagon, but I think the overall price action speaks for itself.
In the upcoming webinar, we will go over my “end of 2022” predictions, one of which was ES 3800. Below that I have the 3500 to 3600 level on my radar, then the ever-scary ES 3000.
I don’t have to tell you how messed up things are. I’m always looking for the silver lining when it comes to life’s ups and downs and I do the best to make good out of bad situations, but I really think we have a reason to be concerned. There are a hell of a lot of “what-ifs” out there and none are improving.
Our Lean
Everyone is looking for the elusive low in the stock market. I hate to say it, but the odds are low for a low.
A bounce? Yes! Will it hold? I don’t believe so.
Today the Federal Reserve will release the minutes of the most recent policy meeting. I don’t think there will be much bullish sentiment in that. Our lean: If you like playing both sides you can buy the early weakness and sell the rallies or just be patient and sell the rallies while keeping an eye on the Globex high as a potential sell area (3969).
The other side of this is the bonds are back at their highs at 142.24 and today’s high is 142.14. Remember the technical layout for this one from last week (written below).
Daily Recap
The ES traded opened Tuesday’s regular session at 3927.75, traded up to 3938.50, and sold off down to 3916 at 9:40. After the low, the ES rallied up to a lower high at 3926.75 at 9:45 and then dropped ~50 points down to 3876.75 at 10:19.
After the low, the ES fell into a big back-and-fill pattern from 10:23 to 10:41 when the ES traded up to 3891.75. After the high print, the ES sold back down to 3872 at 10:53 — a new low.
The ES popped back up to 3892.25 at 11:16 and then dropped down to a ‘double bottom’ higher low at 3875.75 before several small buy programs pushed the futures up. The ES rallied 53.75 points up to 3928.75 at 12:16, then dropped ~40 points down to 3890 at 1:05. Then the choppiness really picked up.
The ES traded 3943.50 as the 3:50 cash imbalance showed $950 million to sell, sold off down to 3930 at 3:55, and traded 3944 on the 4:00 cash close. The ES settled at 3950 on the 5:00 futures close, down 28 points or 0.80% on the day.
In the end, the ES followed through on the downside after SNAP warned of weaker earnings. In terms of the ES’s overall tone and with the exception of the late rip, it was weak all day. In terms of the ES’s overall trade, volume was on the high side at 1.975 million contracts traded.
- Daily Range: 82.5 points
- H: 3954.50
- L: 3873
Technical Edge
- NYSE Breadth: 33% Upside Volume
- NASDAQ Breadth: 24% Upside Volume
- VIX: ~$30
For the second time in three sessions, the market fought back a tough decline in the indices.
At one point on Tuesday, we had 89% downside volume while the ES was down 2.5% (100 points) and the NQ was down 3.8% (460 points). Impressively, those losses were cut to 0.8% and 2.2%, respectively.
We had similar action on Friday.
I don’t know if this is simply delaying the inevitable (i.e. lower prices) or if it’s the bulls making a stand. Either way, it’s something to take note of as the S&P tries to avoid its 8th straight weekly decline.
Remember how that has played out over time.
Game Plan — S&P (ES and SPY), Nasdaq (NQ and QQQ), Bonds, Dollar
We have a $30-handle on the VIX, but there are some individual names trading well. See the Go-To list below for which ones I’m referring to (and I’ll send a separate email).
S&P 500 — ES

Yesterday we wrote: “On the upside — what do you know? — 3950 is key again this morning.”
That remains the case today, even as we momentarily cleared that level during Globex. Above 3950 puts 3970 in play, which is roughly the Globex high and the declining 10-day moving average.
Above 3985 — this week’s high and the 61.8% — is what opens the door to 4050, assuming the ES can clear 4000.
3905 to 3910 remains a key area on the downside. Below it puts yesterday’s 3872 low in play. Then 3855 or lower.
I know there are a lot of levels here. But just move level to level with the ES. That has treated us well thus far in 2022 and we’re not going to veer from it.
SPY

It’s hard to believe the S&P has declined every week for almost two months. It did not seem that long ago that the SPY was trading $450. Now that would seem “expensive.”
The SPY had a nice rebound yesterday, but we really need to see how it handles $397.85. That’s the 10-day moving average, this week’s high, and the 61.8% retrace.
Above this level opens the door to $400, then the key $405 mark.
On the downside, $390 has been critical. A break of that puts Tuesday’s low in play near $387. Below that level and failure to reclaim it opens the door to $385, then the 2022 low near $380.
Nasdaq — QQQ

Yesterday’s candle thrusts QQQ into no man’s land. With yesterday’s gap-down and rally off the lows, the QQQ is now just floating between the 2022 low and recent resistance.
We had a three-day high around $293.30, which was also the 50% retracement — a very clear line in the sand.
Daily-up over $288.86 puts this resistance zone back in play. Above opens the door to the $295 to $296.50 area — the 10-day and the 61.8% retrace.
Daily-down below $282.25 puts the low in play at $280.21.
U.S. Dollar — DXY

We got our dip in DXY and UUP. Now let’s see if we can get some follow-through on the bounce.
Wheat — ZW

The weekly chart for Wheat (ZW) looks a bit interesting as we come back in on the 10-week and 61.8% retrace. Down in 5 of the last 6 sessions, let’s see if it can find its footing around 1090.
Bonds — ZB

Let’s go bonds! We were all over the weekly-up push last week and now we’re getting follow-through into the 143s. I am looking to trim at least ½ of the position should we see 143’00 to 143’09 today.
This could be the start of a new uptrend, but either way, profit isn’t profit until it’s in your pocket!
Go-To Watchlist
*Feel free to build your own trades off these relative strength leaders*
Numbered are the ones I’m watching most closely. Bold are the trades with recent updates. Italics show means the trade is closed.
We have been spanking the very select individual trades we have taken. For that, I’m super grateful! It shows that discipline wins out in a tough tape.
- XOM — this target hit “Above $92+ and feel free to trim as much as you want.”→ B/E stop on the remainder of the position ($89). $96 to $97 is a big extension area if it can really get going.
- XLE — gave us $84 in yesterday’s session → down to runners (⅓ to ¼ of a position) or all out here. Those with runners can look for $87 to $88 if XLE closes above $84.60. Above $79.75 and bulls can stay long this name.
- DXY / UUP — 103.50 to 104 would be the ideal first trim area. For UUP, that’s $27.50 to $28. For the latter, conservative bulls may be waiting for a gap-fill at $27.09 and a tag of the 50-day.
- ZB (bonds) — Weekly-up in play → Looking to trim 143+
Relative strength leaders (List is cleaned up and shorter!) →
- XLE — Above $79.75 and bulls can stay long this name.
- AR
- DLTR
- CTVA
- VRTX
- AMGN
- MRK
- MCK
- JNJ
- BMY
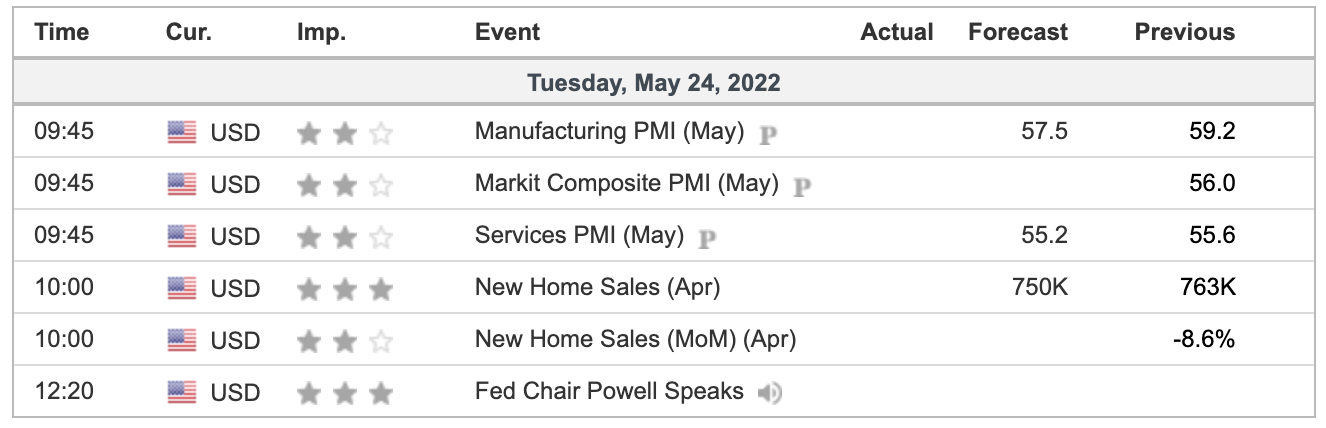
Economic Calendar
As we all know, there’s no crystal ball when it comes to trading stocks, options, or futures. But the Market Imbalance Meter may be as close as it comes. Knowing how the “Big Money” is placing its bets can give our trading room a big wave to ride — or a warning sign to stay out of the water. Come check it out now, risk-free for 30 days.
Comments are closed