Our View
First off, I was dead wrong yesterday. I thought there would be some upside follow through and there was…but on Globex. After the push up to the 4723.25 high and the pre-open 25-point drop, the ES basically went straight down.
I didn’t take into account that the late-Friday and Sunday night rip used up all the buying power.
After the shorts were squeezed out and traders got long into the day, there was no way the ES or NQ could hold up. The Dow couldn’t either. It dropped 350 points in the early goings and another 227 points in the first hour of trading.
Additionally, overnight ES inventory was 100% net long. I also forgot about the MTS rule that says, “the ES tends to go sideways to down after a big rally.”
Our Lean
We all know how large the ranges have been. Yesterday’s total range was about 68 points on the ES. These are not normal times. I had decent profits on my call position, but gave over 40% of it back during yesterday’s decline. While I made money trading the NQ early on, I ended up losing what I made and more.
I think it’s really important to understand that I made a mistake yesterday. I am the one that likes to sell the early rallies or gap-ups and I know overnight inventory was 100% net longs. All classic signals I would usually be taking.
In a nutshell, I got bullish after a big rally and with the way the current two-way price action works, that’s a no-no. The PitBull has told me time after time to “trade the position.” In other words, when you have big profits, take half off and replace the position lower. That was something I could have done.
Don’t get me wrong, I am not mad at myself as much as I am disappointed I didn’t follow what the PitBull taught me. That said, today is another day.
The ES should bounce today, but if the ES rallies 30+ points there may be a sale. There is no doubt that investors were unloading and that was evident in the MIM flipping from over $1.4 billion to buy to $2.7 billion to sell. The other part of this all of the sell programs that hit on the half hour.
Our lean is two fold: Sell the 30+ handle rallies and patiently buy the dips. Further, it’s possible the ES stays a bit weak until after the Fed.
Here is the Ned Davis S&P and Nasdaq cash study for the 2021 December options expiration.
The Opening Print Recap
The ES traded up to 4723.25 on Globex, up 18.5 points from Friday’s settlement. That high came on Sunday evening, but the ES made a second charge higher at 6 am Monday morning. The rally came up short of the Globex high by a point. Then the sellers stepped in.
By the open, the S&P futures were down 24 handles from the 6 am high and continued to decline from there. In all, the ES fell in nine out of the next ten 30-minute windows after 6:30.
The selling came to an end after a 60-point decline, with the buyers making a stand near 4663. After the low, the ES rallied up to 4675, pulled back 4 points and rallied up to 4676.50 at 12:40.
Basically from 1:00 to 2:20 pm, the ES back-and-filled in a 5- to 7-point trading range until it traded up to 4680.25 at 3:06. For the next 40 minutes, the ES traded in another 5- to 7-point range before dropping down to 4667 as the 3:50 cash imbalance showed $2.7 billion to sell. From there it took out the low and traded down to 4657.50 at 3:59 and traded 4661 on the 4:00 cash close.
After 4:00, the ES continued down to a new low at 4655.50, rallied 10 points up to 4665.50 and selltted at 4663.50 on the 5:00 futures close, down 41 points or 0.88% on the day.
In The End
In the end, it was all sell programs and sell stops. In terms of the ES’s overall tone, it was weak — but not as weak as the NQ or Russell, which fell 1.42% and 1.14%, respectively. In terms of the day’s overall trade, volume was above average 2.33 million.
As we all know, there’s no crystal ball when it comes to trading stocks, options, or futures. But the Market Imbalance Meter may be as close as it comes. Knowing how the “Big Money” is placing its bets can give our trading room a big wave to ride — or a warning sign to stay out of the water. Come check it out now, risk-free for 30 days.
Technical Breakdown
- NYSE Breadth: 78.3% downside volume
- NASDAQ Breadth: 63.6% downside volume
We came into Monday’s open excited to see what the week could bring us. That was after the inside week (and high close) on the Nasdaq and as the S&P 500 finished with a weekly-up rotation.
Monday’s action was disappointing for the bulls. There’s no other way to put it.
That said, I am quite content with how we maneuvered the day with our game plan.
We were cautious on Apple, a stock that gapped up and gave us a bearish reversal, resulting in a 2.1% decline on the day. How many people came into the day cautious on Apple? Pfizer also paid off well, gapping higher and climbing 4.6% on the day.
This is not some lame horn-tooting, but a reminder that proper game-planning without a bias can lead to less stress during the day.
The Game Plan
We’re not going to go crazy here. Yesterday I wrote that it’s Quad Witch expiration this week, combined with a two-day Fed meeting (announcement due up on Wednesday). Why do something stupid and get chopped up in this pre-holiday mess until we have some clarity?
We have been watching The Homebuilders ETF (XHB) all month and now it’s giving bulls a nice little dip. Let’s see if it gets bought.
P&G has been on fire and may be a buy-the-dip candidate, while COST gave us an inside day just below $560 resistance. Can it break out in the days ahead? It’s something to watch.
S&P 500
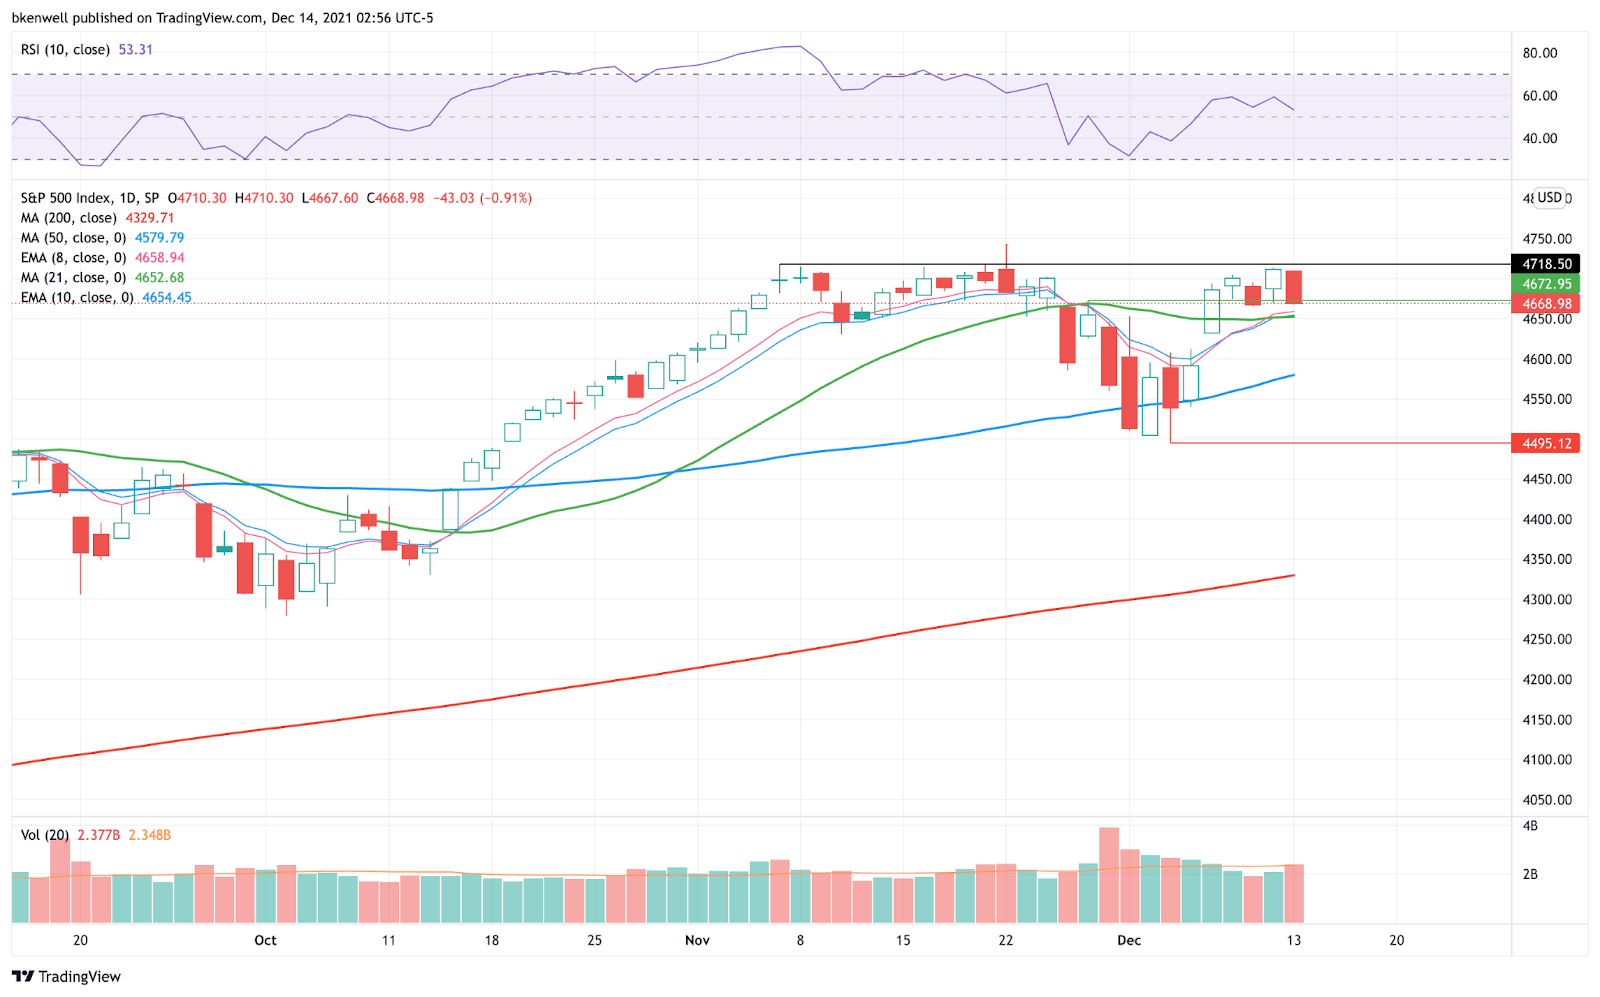
Yesterday I said that I wanted to see the S&P 500 hold the prior week’s high near 4672. It finished near that mark on Monday. If it holds, we’ll have to see how the SPX handles the 4700 area.
If it doesn’t, the 4650 area will be critical, which is where the index finds its 10-day and 21-day moving averages.
Not a lot has changed in the outlook despite Monday’s action.
Nasdaq

Yesterday we said a break of 15,500 would put the 50-day moving average in play, followed by the gap-fill at 15,280.
So far we have (essentially) tested the 50-day. If holds, let’s see if the Nasdaq can reclaim its short-term moving averages. Below the 50-day and the 15,280 level could be in play.
Like the ES, not a lot of changes here.
Individual Stocks
As I said at the top, I couldn’t have been much happier with how yesterday’s individual stocks played out. If Apple continues to roll over from the bearish reversal, let’s see if it finds some support near the 10-day moving average.
As for the XHB, PG and COST, here are the accompanying setups.
XHB

PG

COST

Disclaimer: Charts and analyses are for discussion and education purposes only. I am not a financial advisor, do not give financial advice, and am not recommending the buying or selling of any security.
Remember: Not all setups will trigger. Not all setups will be profitable. Not all setups should be taken. These are simply the setups that I have put together for years on my own and what I watch as part of my own “game plan” coming into each day. Good luck!
Economic Outlook

Comments are closed