Earnings begin in earnest on Friday
Follow @MrTopStep and @BretKenwell on Twitter and please share if you find our work valuable.
Our View
While volume in the S&P futures rose to almost 2 million contracts on Friday, the volume on the ‘Big Board’ was just over 900 million. They say light volume on the upside is not a good indicator, but nor is global equity funds posting their 14th week in a row of outflows. I’ll also just add that volume tends to be higher on the pullbacks than on the rallies.
According to the U.S. Survey of Professional Forecasters, this is the most worried that economists have ever been about a US recession. In the most recent results, nearly 44% of respondents expected America’s gross domestic product (GDP) to decline over the next year.
That’s the highest number in the survey’s 54-year history. I have mentioned this before: I don’t believe it is a one-and-done stock market decline. And despite what Friday’s better job number suggests, there have been and will continue to be massive layoffs.
We’re now seeing layoffs outside of tech and crypto. We’re now seeing it at Goldman Sachs, McDonald’s, PepsiCo, Gap and others. It’s just something to keep in mind ≥
Our Lean — Danny’s Take
After 3 days of range-bound trade in the new year — and 13 sessions overall — the ES rallied sharply Friday.
The jobs report was meaningful and in hindsight, it’s no surprise that Friday turned into FRY-day. However, this week is the big one to watch.
Three Fed governors speak this week, while Powell will speak on Tuesday morning. On Thursday we get the all-important CPI report, while the banks — BAC, C, JPM, WFC, BK and BLK — kick off earnings on Friday.
Our Lean: I think we all knew the 3800-3900/20 range was not going to last forever and now it comes back to the same old question…will the rally hold? Don’t forget, the ES closed near ~3915, within that key 3920 area.
I have a feeling we can see higher prices, but I don’t think the ES goes straight up. Our lean is to sell the early rallies and buy 30 to 40-point pullbacks.
MiM and Daily Recap

The ES rallied up to 3849 and sold down to 3819 at 8:23 am and opened Friday’s regular session at 3861. The ES rallied up to 3875, then tumbled down to 3839 at 9:46, and then rallied up to ~3875 at 10:18. After the push, the ES pulled back to the 3861 area and then rallied up to a new high at 3997 at 11:07, pulled back to 3885.50 and then “double topped” at 3903.25 at 11:54 and pulled back to 3886 going into 1:00.
The ES ultimately climbed up to 3928.75 at 3:17 as the early MIM showed $869 million to buy. It traded 3924 as the final 3:50 cash imbalance showed $136 million to buy and traded 3916.25 on the 4:00 cash close before settling at 3913.75 on the 5:00 futures close, up 86.50 points or +2.25% on the day.
In the end, the crowd was short — too short — and there was an abundance of buy stops going into the better-than-expected jobs report. That was a big part for the first portion of the day, but the options expiration threw gas on the fire. In terms of the ES’s overall trade, it acted solid. In terms of the ES’s overall trade, volume has been steady all week, while 1.93 million contracts traded on Friday.
Technical Edge —
- NYSE Breadth: 83% Upside Volume
- Advance/Decline: 87% Advance
- VIX: ~$21.75
For the bulls, the S&P futures look “better” than the SPX or SPY. I like to use both instruments in tandem with each other. In that sense, the SPX/SPY still looks a tad cautious to me.
Let’s go over why and then touch on some individual setups. While the tape broke in favor of the bulls on Friday, I’m still a bit cautious as things can unravel quickly. Keep that in mind in regards to position size, position count and ideal setups.
S&P 500 — ES

You all know how key the 3920 pivot area has been for the ES. We poked through this level on Friday, but closed below it. The Globex rally has the ES slightly above this level now.
Continue to play the ES just as we always do: By going level to level.
Over 3920 keeps last week’s high in play at 3928.75. Above that puts the Globex high in play, followed by the levels we laid out last week, starting with 3985 to 4000. There we find the 50% retracement and 200-day moving average.
Below 3916-20 puts 3900 in play, then 3975 to 3980.
SPY

See what I mean by the ES looking better than the SPX?
The ES is technically over its pivot, while the SPY is still struggling with $390. If the SPY can power through $390 — where it also finds last week’s high and the 50-day moving average — then it opens the door to $396.75 to $398.50.
There it finds the 61.8% retracement and declining 200-day moving average.
On the downside, the bulls don’t want to give up much ground below $386.
COP
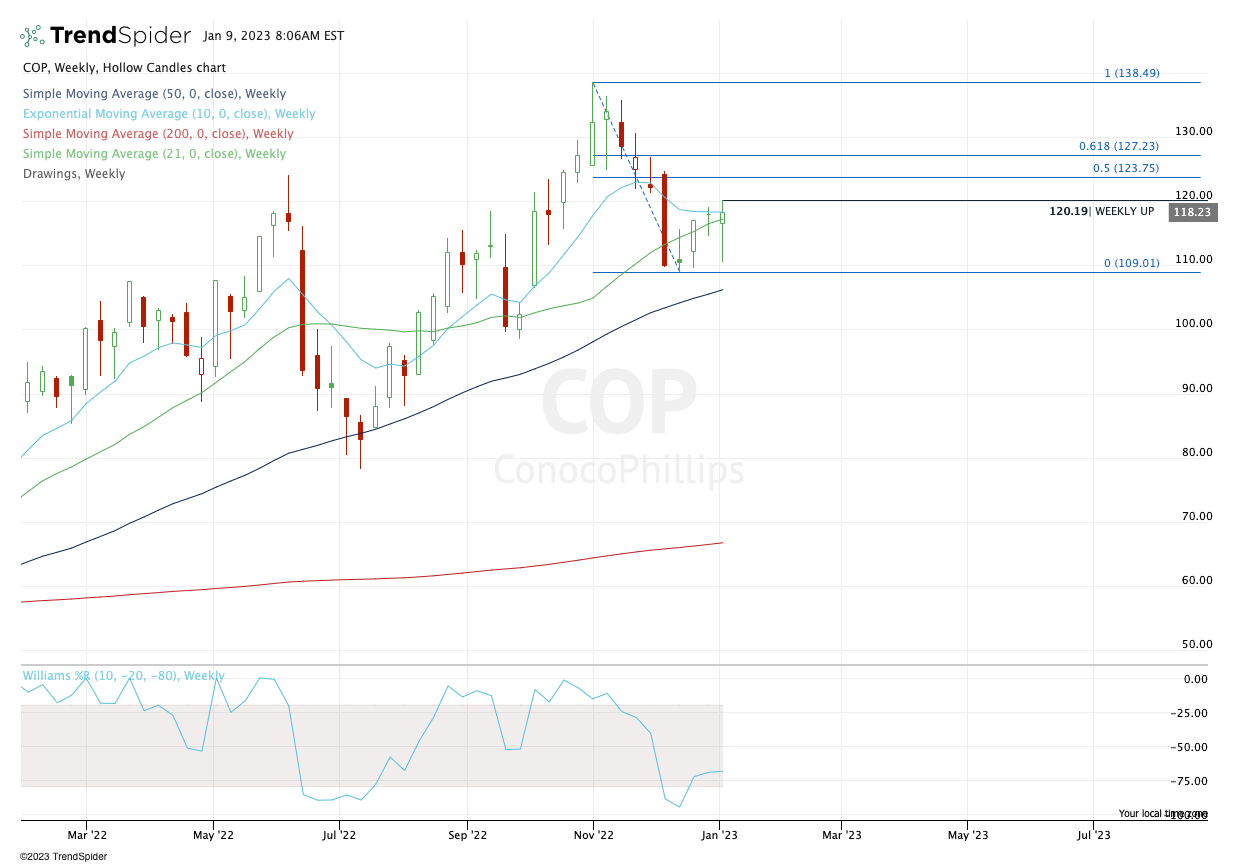
Some of you may already be in from Friday’s attempted rally over $119, but part of the plan was: “Really, the ideal setup would come next week.”
That would be a 2x weekly-up rotation, now over $120.19. Either way, COP is trading higher pre-market and while I don’t like buying right at 9:31 on Monday, I do think COP is one to keep an eye on.
If we can push over $120.19 and gain some momentum, $124 to $127 could be a reasonable trim spot. (Keep in mind, the 50-day is at ~$122, so maybe ⅕ to ¼ trim there just for lunch money).
BRK.B

Generally, I’m someone who would rather buy the pullbacks rather than the breakouts — especially in a bearish tape. That said, if Uncle Warren’s Berkshire can gain some steam over $319-$320, this one could continue to fly.
If we get it today, maybe consider a ½ position.
FSLR

As I said, I’m more of a dip-buyer than a rotation buyer in this tape, so what a bummer it was to miss that dip last week to the prior breakout area and 21-week sma.
Oh well. Here we are.
½ position if we can clear $157.75 and hold above it. $162 would be our first trim zone. I’m not going to risk the bottom of the candle. Consider the 10-week/$149-150 area as our initial stop.
Open Positions —
- Numbered are the trades that are open.
- Bold are the trades with recent updates.
- Italics show means the trade is closed.
- UUP — We hit our second trim spot (~28.40) to get us down to ½ position, then the UUP’s reversal hit our stop in the 27.90s. Out now.
- TLT — Down to ⅓ after TLT’s strong push to $105 on Friday. Raising stops to $100 or $101 and (I personally) am just leaving a runner against the stop.
- DE — Got our first trim at $425. $430 to $435 is our next trim zone, so let’s just call it the 21-day sma at ~432.50. B/E stop now.
- /NG (can use UNG too) — Trim some up above $3.90 if you’d like, but ideally looking for $4+. A ¼ trim here isn’t a bad idea.
- We’ve had a nice move out of support and off the lows, so I am going to a B/E stop.
Go-To Watchlist
*Feel free to build your own trades off these relative strength leaders*
Relative strength leaders →
- SBUX — nicely weekly-up setup after 10-week ema reset.
- DE — gap-fill & 10-week would be attractive for potential longs
- SMCI — daily-up over $85.12 could get some bullish momentum going.
- TJX, ULTA — looking for pullback here to active support (10-day) given the bearish update from LULU.
- CAT
- MRK
- CAH
- BRK.B
- LNG
- LMT, RTX, NOC — RTX best of the bunch
- MET — weekly
- GIS
- HON — weekly
- FSLR — $140 is the 21-week sma and retest of prior resistance
- XLE — XOM, CVX, COP, BP, EOG, PXD — (Weekly Charts)
Economic Calendar — The Week Ahead

As we all know, there’s no crystal ball when it comes to trading stocks, options, or futures. But the Market Imbalance Meter may be as close as it comes. Knowing how the “Big Money” is placing its bets can give our trading room a big wave to ride — or a warning sign to stay out of the water. Come check it out now, risk-free for 30 days.
Comments are closed