Still looking for that Thursday/Friday low.
Follow @MrTopStep and @BretKenwell on Twitter and please share if you find our work valuable.
Don’t Forget: The Long-term performance of the S&P 500, some longer-term setups, and 5 red flags that showed up before the 2022 bear market.
Our View
Tis the season, right? Well…yes it is, but that doesn’t mean you can let your guard down. I know a lot of people like trading right into the end of the year, but if there was any time to slow it down and pick your spots better. There has been a lot of money lost around the holidays and we don’t want that.
I remember several years at my S&P desk that some of the accounts would still be pushing the futures around on Christmas Eve. I know some will argue, but all I can say is I have seen this dance and it ruins the holidays and adds undue stress. I would even discourage the customers from trading unless they had to.
Everyone talks about the Dec Quad Witch and the Fed, but there’s also the PPI report on Friday, the CPI report next Tuesday and the all-important end-of-the-year rebalance (which is usually the last three sessions of the year). This is where huge amounts of money will be moving around.
The moral of the story is, be smart over the next few weeks. It’s great if you can scrape some cash out, but with so little time left in the year, it will be hard to make it back if you’re wrong.
Quote from the PitBull about December:
“Bide your time. Anything can happen. December and January can be squirrely.”
Our Lean — Danny’s Take
Today we will be looking for the Pitbull’s Thursday/Friday low the week before regular expiration (which is next Friday).
Despite the weakness in the NQ yesterday, there was a buyer floating around in the ES nearly all day. Yes, it’s oversold, but if the NQ is going down the ES is going to go for the ride too. Let’s face it, there is an overload of important events between tomorrow and next Friday.
Our Lean: You have two options, of which I am only looking to do one. You can sell the early rallies and buy the weakness (preferably at or near the lows late in the day). I think a 2 or 3-day rally is coming. Yesterday’s “pause day” will either hold and rotate to the upside or fail and we’ll know fairly quickly.
If 3920 fails, 3904 is next, and that’s where some of the big sell-stops start. Below that puts 3870, 3830, and 3800 in play.
MiM and Daily Recap

The ES traded up to 3954 and sold off down to 3914 on Globex, then opened Wednesday’s regular session at 3933.75. After the open, the ES traded 3930.50 and in 8 minutes rallied up to 3957.75. After the rally, it sold off ~33 points down to 3924 at 10:01. In 31 minutes the ES rallied ~27 handles and sold off 28.50 handles — AKA choppy.
The ES rallied up to 3547.75 and then a headline hit saying: “RUSSIA CONSIDERS NUCLEAR WEAPONS A RESPONSE TO AN ATTACK.”
The ES quickly sold off down to 3927.50 and then ripped back up to and then ran up to new highs at 3961.50 at 10:31, then fell back down to the 3927 level at 11:35. The ES chopped around for most of the afternoon like this, then traded 3933 at 3:50 as the MIM showed $1.2 billion for sale.
The ES traded 3938.50 on the 4:00 cash close and settled at 3934.50 on the 5:00 futures close, down 5 days in a row and down 8 points or 0.2% on the day.
In the end, it was an all-day rotation; buy ES and sell NQ. In terms of the ES’s overall tone, the ES acted oversold. In terms of the ES’s overall trade, volume was steady at 1.71 million contracts traded. The last time the S&P closed down 4 sessions in a row was Nov. 3rd and down 5 in a row has not happened since Oct. 12th.
Technical Edge
- NYSE Breadth: 33% Upside Volume
- Advance/Decline: 48% Advance
- VIX: ~$22.75
It was a quiet “pause” day in the indices yesterday. The S&P finally found its footing and closed lower by just 0.19%. Technically in a five-day rut, the index is holding where it needs to, although there are concerns brewing below the surface.
This again feels like we’re setting up in a binary situation. If the PPI/CPI/Fed impresses, then the markets can rip out of this pocket and retest the recent high. If that trio disappoints, well then, we’ll be testing lower support levels.
ULTA, CEG and TLT were in a giving mood yesterday and here at The Opening Print, we are very grateful to keep finding some quality setups in what has been a tough tape. Keep raising stops, keep your position size smaller — especially after a nice run like this — and keep trimming into favorable upside moves.
Let’s keep it simple with a look at just the S&P 500 this morning.
S&P 500 — ES
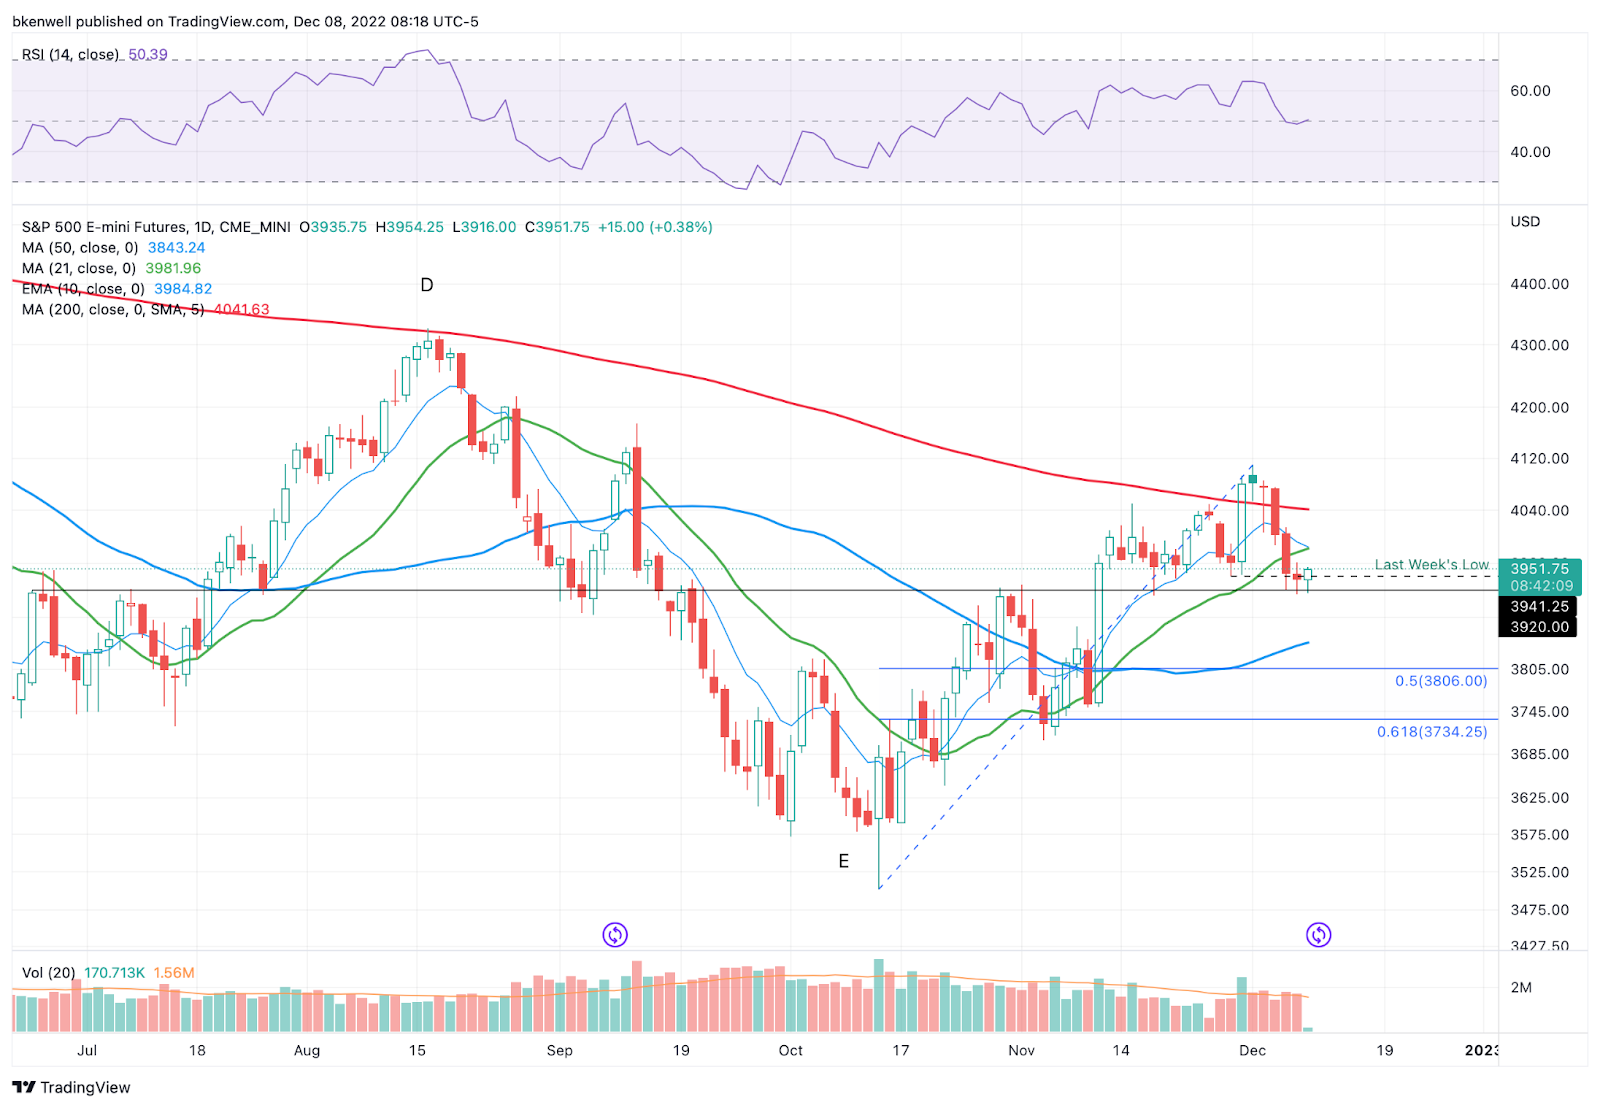
Look at that 3920 pivot. It’s a thing of beauty. As it continues to hold as support, keep an eye on yesterday’s high at 3961.50.
If the ES can go daily-up without reversing back down, it opens the door up to the 3980 to 3985 area. Above that will have investors looking for 4000, but I’m more interested in 4010 to 4015. Lastly, we have 4035 to 4040, although I don’t expect that today.
On the downside, it’s pretty darn simple. Lose 3920 and the bulls are dealt a serious blow. It could open the door down to 3840 to 3850 in a heartbeat, then 3805.
SPY

SPY is a little messier, IMO. It’s holding the 10-week and 21-week moving averages, but remains below last week’s low of $393.30. Bulls need to see the SPY reclaim and hold above this level.
Keep an eye on yesterday’s high at $395.64. We’re trading near or above that level in the pre-market now.
We could have some type of reversal back below that level for a quick cash-flow trade if breadth is poor. However, if the SPY maintains above yesterday’s high, see how it handles $397.
Above it could eventually open the door to $398.50, then $400.
On the downside, a break of $391.50 to $392 opens the door down to the key $390 level.
Open Positions —
- Numbered are the trades that are open.
- Bold are the trades with recent updates.
- Italics show means the trade is closed.
- TLT — Trimmed down to our final ¼ or ⅓ a $108.50. A complete exit is okay too. Those still holding can fish for the $110 to $111.50 area.
- TJX — trimmed ½ at $81. B/E Stop
- IBM — Daily-up over $147.17 was the entry. $145.50 is our stop. Trimmed ⅓ at $149.50+ (pre-market is fine). Ideally down to ½ if we see new highs over $150.50.
- Stop at $145.50 or B/E for less aggressive traders (B/E Stop hit)
- CEG — Trimmed ⅓ at $93. Raise stops from $86 to $89. Looking for $95 to $96 for small trim (down to ½). Down to ⅓ if we see $97.50+
- Ulta — Booyah! Down to ½ or ⅓ here — likely ⅓ as per yesterday’s update. I’d love to see $488 on the remainder.
Go-To Watchlist
*Feel free to build your own trades off these relative strength leaders*
Relative strength leaders →
- LNG
- CAH
- Retail — TJX, WMT, ULTA
- SBUX
- DE
- CCRN
- AMGN
- MET
- GIS
- REGN
- CI
- MCD
- ENPH, FSLR — solar has strength
- VRTX
- UNH
- MRK
- XLE — XOM, CVX, COP, BP, EOG, PXD (Weekly Charts)
Economic Calendar

Comments are closed