Our View
The ES shot its wad in Thursday’s overnight session into early Friday morning, as it roared to new all-time highs then reversed hard. There are contrary opinions about what to expect during Thanksgiving week. Some think the S&P is going to be up all week and others are looking to buy weakness going into the holiday.
I don’t know which one it will be. But what I do know is this: A sell-off into Thanksgiving generally gives a unique opportunity for one of the best buying opportunities of the year.
This week will be a busy week. The S&P usually does well during Thanksgiving week, but there are some different variables in play this year.
First, President Biden is going to make his decision on Jerome Powell to head the Fed or replace him with Fed Gov. Brainard, who many say follows the same playbook. So far, Powell is the favorite to remain at the helm. Still, any news regarding the Fed Chair is headline-worthy news — both for traders and the algos.
Second, the Federal Reserve’s most-watched inflation measure will be released: The personal consumption expenditure data. That will hit at 10 am ET on Wednesday. On that day, we also have durable goods orders, Q3 GDP, initial jobless claims and new home sales, followed by the FOMC Minutes in the afternoon.
Our Lean
The average gain for the S&P between its October low and the end of the year is 7.2%, but by early November, the S&P 500 was already up more than 9% from its low. My question is, what’s going to stop the ES from taking out 4723?
I think “thin to win” could easily push the ES up through this level, unlocking additional upside.
According to Statista.com, over 50 million people will travel in the US over the Thanksgiving holiday. As volume drops, the ES will drift higher. There are some occasions where the ES sells off early in the week, but that tends to only help push the ES higher after the pullback.
Our Lean is to sell the early rallies and buy the pullbacks. There is a high probability the ES rallies sharply today and this week. I know it sounds counterintuitive to sell the early rallies, but unless we get a gap-and-go scenario, selling the gap-ups and early rallies has been atop the playbook all month.
Danny’s View: The Opening Print Recap
Remember how stubborn that 4,700 level has been? Well the ES settled at 4699 on Thursday, rallied all the way up to new all-time contract highs at 4723.50 overnight, and sold off 36 points down to 4684.25 at 5 am. What happened?
Increasing lockdown pressure in Europe, a potential new Fed president, and oil falling over 3% certainly didn’t help sentiment.
After trading down to the Globex low mentioned above, the ES started to short-cover shortly before the open, climbing to 4704.25 and opened Friday’s regular session at 4700.50. From there, the ES shed almost 10 points before popping to 4703.25 and then worked its way back down to 4696.75 in the first 16 minutes.
The ES then rallied ~10 points up to a new daily high at 4707 and then dropped about 15 points down to 4692.50 around 10:30. In other words, it was a very choppy day session, while that early high at 4707 became very important for the rest of the morning.
After some back-and-forth action around the VWAP measure, the ES finally broke out over 4707, climbing to 4714.25 at 12:30. Many traders thought this would be the upside squeeze that could put 4720 to 4723.50 back on the table. But it didn’t take long for the ES to peter out, then drop over 24 points down to 4690 at 1:42.

After the low, the ES rallied back up to 4703 and pulled back to 4691.50 at 3:47. The ES traded 4695 on the 3:50 cash imbalance as the MiM flipped to $82 million to sell. The ES traded 4693.75 on the 4:00 cash close and settled at 4697.75.
In The End
In the end, there were two big moves and both were on Globex. In terms of the ES’s overall tone, the rally was laborious — like it wanted to rally but couldn’t muster up enough buying power. Further, it had a hard time holding a bid.
In terms of the ES’s overall trade, volume picked up slightly: 347,000 ES contracts traded on Globex and 928,000 contracts traded on the day session for a total of 1.275 million contracts traded.
If you want to know why the ES didn’t trade 4730, it’s because all the buying was used up on Globex and all the Covid-19 lockdown news spooked the bulls.
As we all know, there’s no crystal ball when it comes to trading stocks, options, or futures. But the Market Imbalance Meter may be as close as it comes. Knowing how the “Big Money” is placing its bets can give our trading room a big wave to ride — or a warning sign to stay out of the water. Come check it out now, risk-free for 30 days.
Technical Breakdown — SPY, QQQ, Breadth
In the section above, Danny wrote that “the rally was laborious — like it wanted to rally but couldn’t muster up enough buying power. Further, it had a hard time holding a bid.”
That observation can be observed through the market’s breadth. We have been yammering on about the breadth lately, as it clearly shows the lack of commitment from buyers. In fact, breadth declined all week on the NYSE.
Below is a look at the daily upside volume readings for the NYSE and NASDAQ.
| Monday | Tuesday | Wednesday | Thursday | Friday | |
| NYSE | 53% | 39.7% | 31.7% | 28.5% | 26% |
| NASDAQ | 45% | 56% | 26% | 32% | 50.5% |
Breadth obviously doesn’t tell the entire story, but it shows how — even on some of the market’s stronger days — breadth was poor. Short of Monday, the NYSE couldn’t even muster up a 40% upside day.
In three of the sessions, we effectively had a 68% downside volume or worse. So that’s really telling on where this lack of commitment is on the upside and ultimately why the S&P couldn’t give us that weekly-up rotation by Friday’s close.
Now what? Let’s look at a few charts of the SPY.
SPY Weekly

Beginning with the weekly chart, you can see how the SPY continues to bump up against the 161.8% extension. In reality, sometimes technicians get a lot of you-know-what from other investors for our “random lines on a chart.” But this was a classic example of what trimming into an upside target should look like.
You may remember last week we raised our risk level in the S&P futures (ES) up to 4667. On Thursday, the market bottomed at 4668.
Applying that same risk level to the SPY, we get $466.23.
That is Monday’s low, as well as last week’s low. With that tight-ranged doji candle from last week, a rotation through the low could trigger some sell-stops.
If that happens, I think we may see the 21-day moving average, followed by the prior week’s low near $462. That all said, last week was Opex week — which gives us choppy and mixed signals.
That was clear in the breadth readings, as well as the back-and-forth action all week. If we can resolve higher and effectively go three-times weekly-up over ~$471, that could open the door to the $480 to $482 area, followed by a potentially larger move higher.
SPY Daily

Who has the advantage here, the bulls or the bears? Let’s hear it.
Bulls: The trend is obviously in favor of the longs right now. One could say that the bulls have been consolidating their gains for three weeks, mostly chopping around the $470 area. Any sort of significant breakout over $471 really should shift momentum in their favor and the holidays should help in that regard.
Bears: The argument for the bears is pretty simple. Breadth has shifted lower, while inflation remains high and the market is stalling near the highs. There’s also that very notable divergence on the daily chart above, as the RSI is far from making new highs, while the SPY did on Friday.
The bottom line is rather simple.
The bear case is not the leading case unless we trigger below last week’s low at $466.23. That has the potential to kickstart a larger pullback. But even in that case, a 3.5% to 5% pullback down to the prior breakout level near $454 and the 50-day moving average seems about as far as we will slip in the short term.
Why? Divergence is only an observation — not a catalyst in and of itself.
Further, mixed breadth can be read during choppy Opex weeks and during consolidation. Lastly, inflation is high — and that’s a problem — but it has been high for a while now. We don’t know when the market will start to care about it.
QQQ

As for the QQQ, the divergence in this one is a bit more prominent. It’s not something that’s getting us outright short of course, but it is something we are keeping an eye on.
Bottom Line: The open will be important here. Currently, the QQQ is gapping above Friday’s high of $405.30. A reversal below this high that doesn’t find a bid could shift us into a more risk-off situation in a short week.
That said, if the QQQ can hold above the prior all-time high of ~$401, then the bulls will surely remain in control. Keep in mind that, unlike the SPY, the QQQ has put together four straight daily gains and closed at all-time highs after a weekly-up rotation last week. It’s also up in six of the last seven sessions.
Apple, Amazon and others could be getting going too. If FAANG runs, breadth will hardly matter.
Individual Stocks — AMZN, AAPL, TTD, DOCN & More
There are actually a ton of names to take a closer look at right now. Let’s start with the “AA” lineup out of FAANG: Apple and Amazon.
Apple
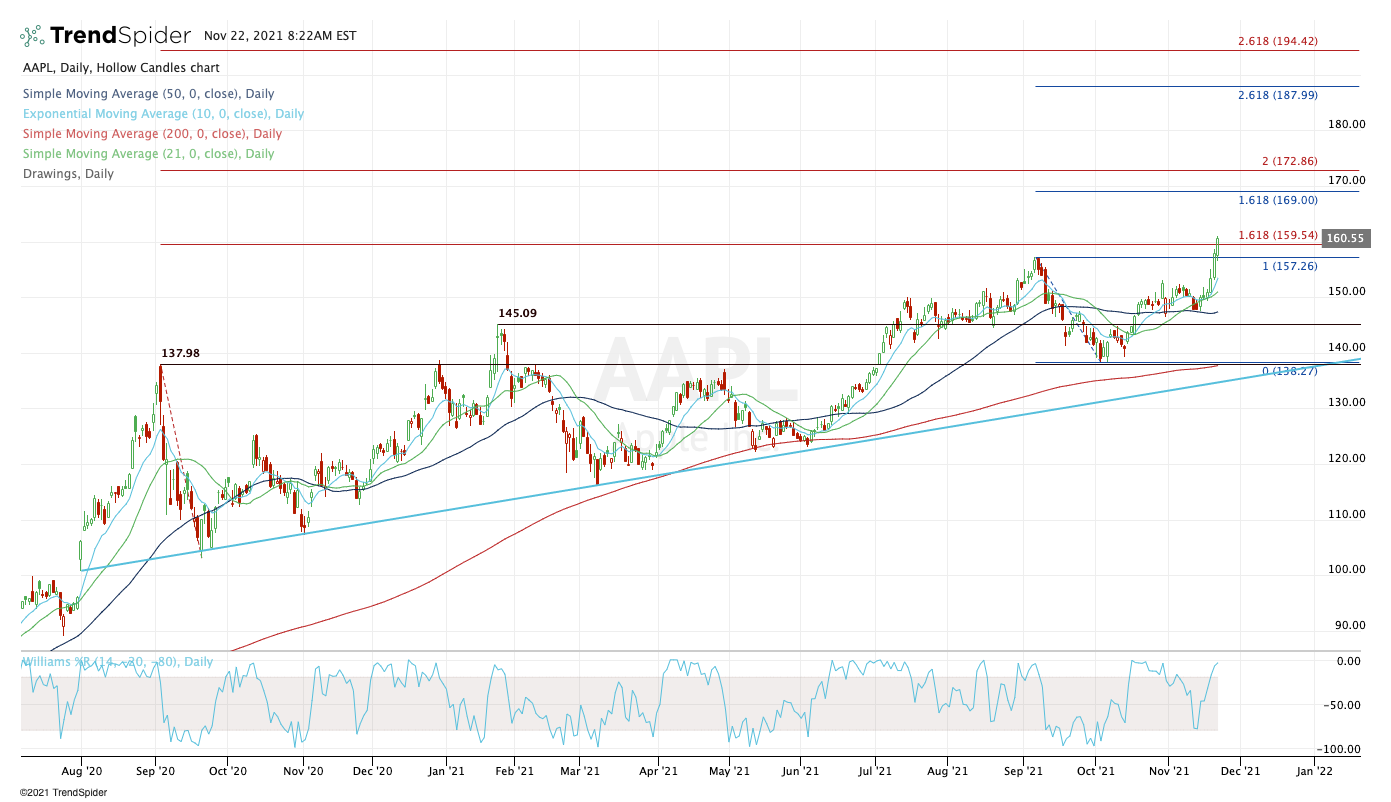
First, allow me to apologize for all the extensions on the chart. Apple has several key ranges we like to measure from. In this case, we got a daily- weekly- monthly- and quarterly-up rotation last week. That’s pretty damn impressive as AAPL now sits at all-time highs.
Most importantly, I want to see it hold above the prior all-time high near $157.25. If it can’t, bulls will need to see this one hold above the October high near $153 and the 10-day moving average.
If it can do those things and continue to push higher, the $169 to $172 area could be the next upside target zone.
Amazon

This chart was looking so good on Friday morning, as Amazon was rotating into the prior all-time highs. However, it reversed hard off the $3,750 level.
This is a key week for Amazon and not just because of Black Friday and Cyber Monday. Bulls have been patiently awaiting a breakout in this name and a solid close on Friday would have gone a long way to putting the $3,900 to $4,000 zone in play.
Now longs are forced to take a step back, especially with AMZN closing on the lows. A daily-down rotation through $3,675 that isn’t reversed may put some shorter-term moving averages in play on the intraday charts (like the 2- and 4-hour charts). Otherwise, we may need to revisit the $3,550 breakout area and the 10-day moving average.
Over $3,762 and new all-time highs are likely on the deck.
Still, Amazon is now a “prove-it” play.
KKR

Incredibly tight back-to-back inside weeks. Weekly up over $79.16 puts $80+ in play with the ATH up near $84. It’d trim around +$2 a share personally and look for $83.50 to $84.
Weekly-down below ~$76.95 could put the 10-week moving average and $74 area on deck.
Home Depot

Incredibly strong post-earnings reaction. Trading higher in the premarket now, watch for a gap above $410 that’s faded. Incredible buy-the-dips stock, but starting to look tired after a four-day, 10% rally.
TTD, DOCN, AVGO etc.
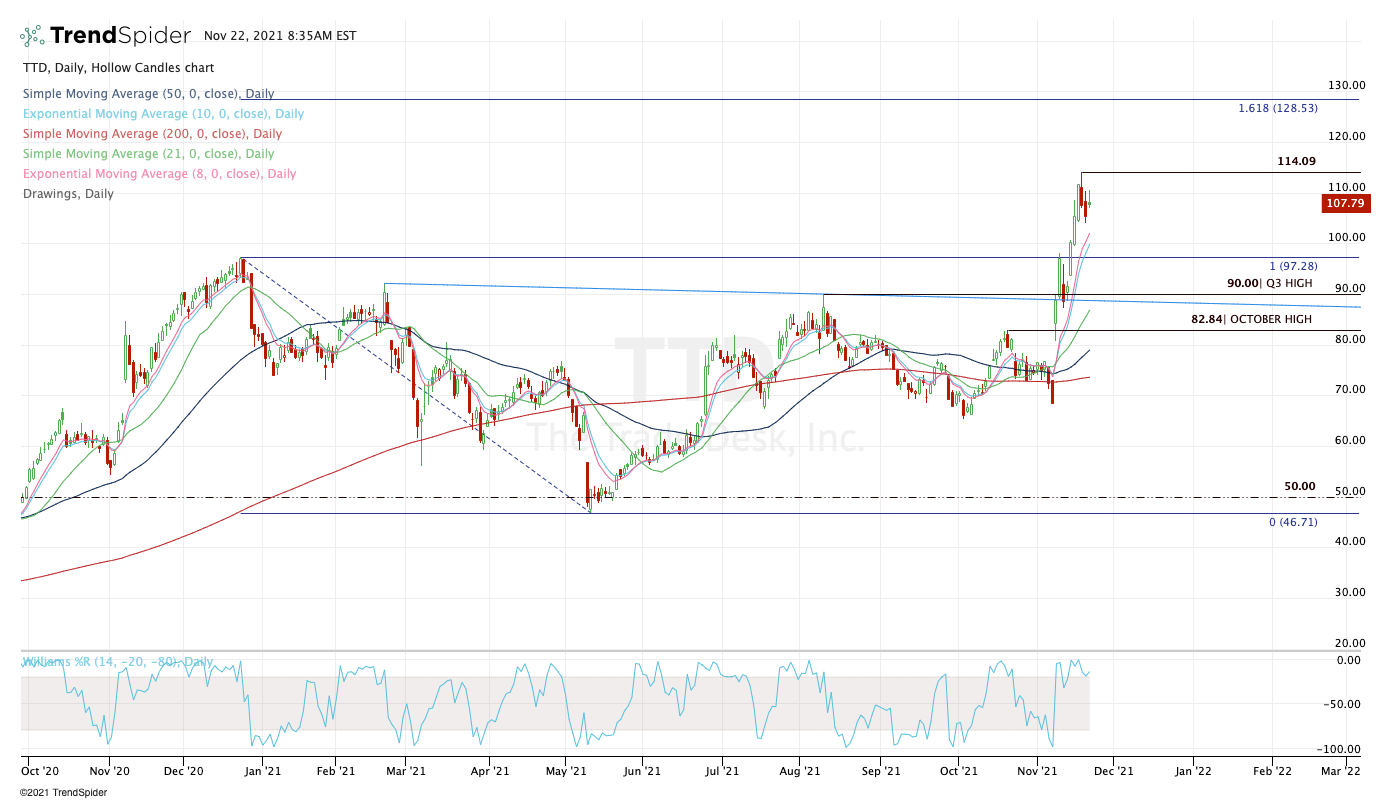
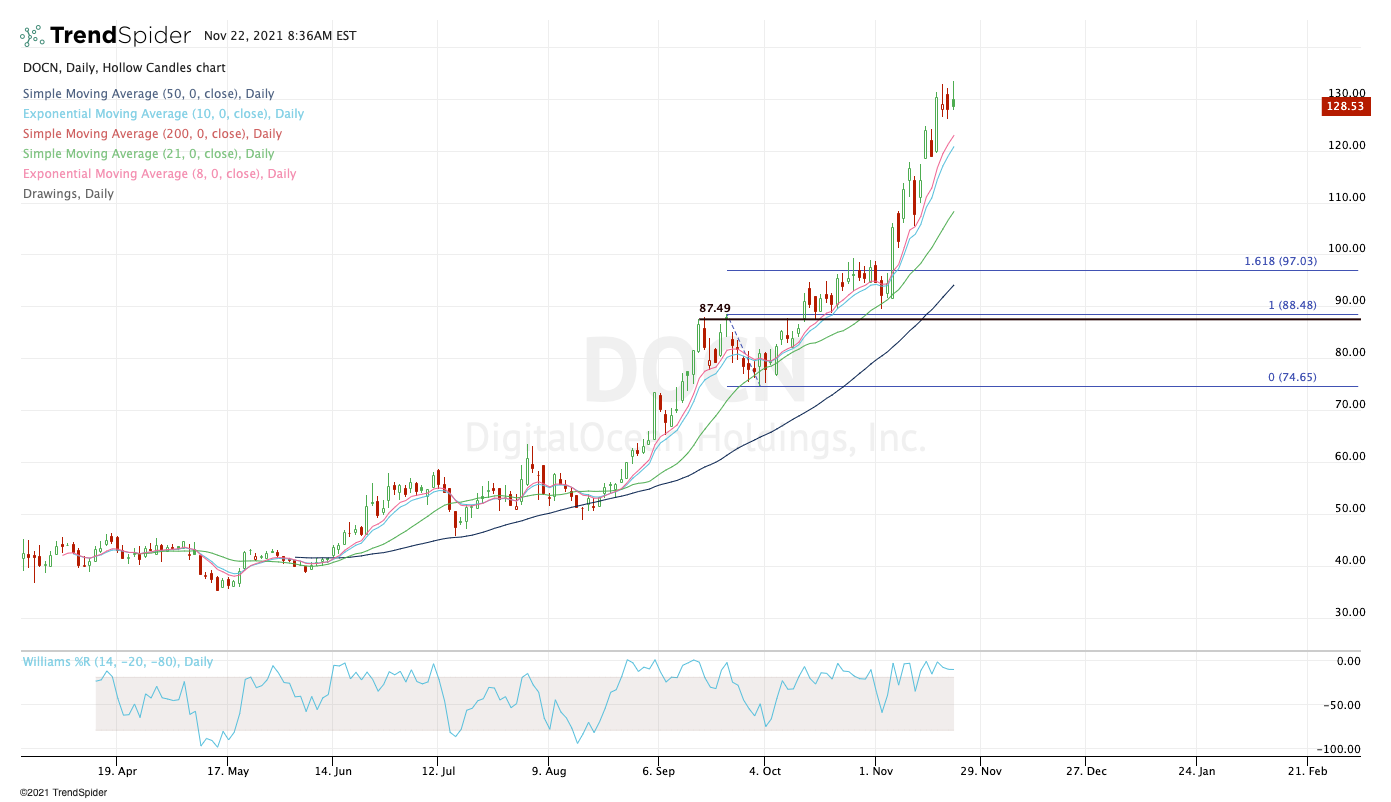
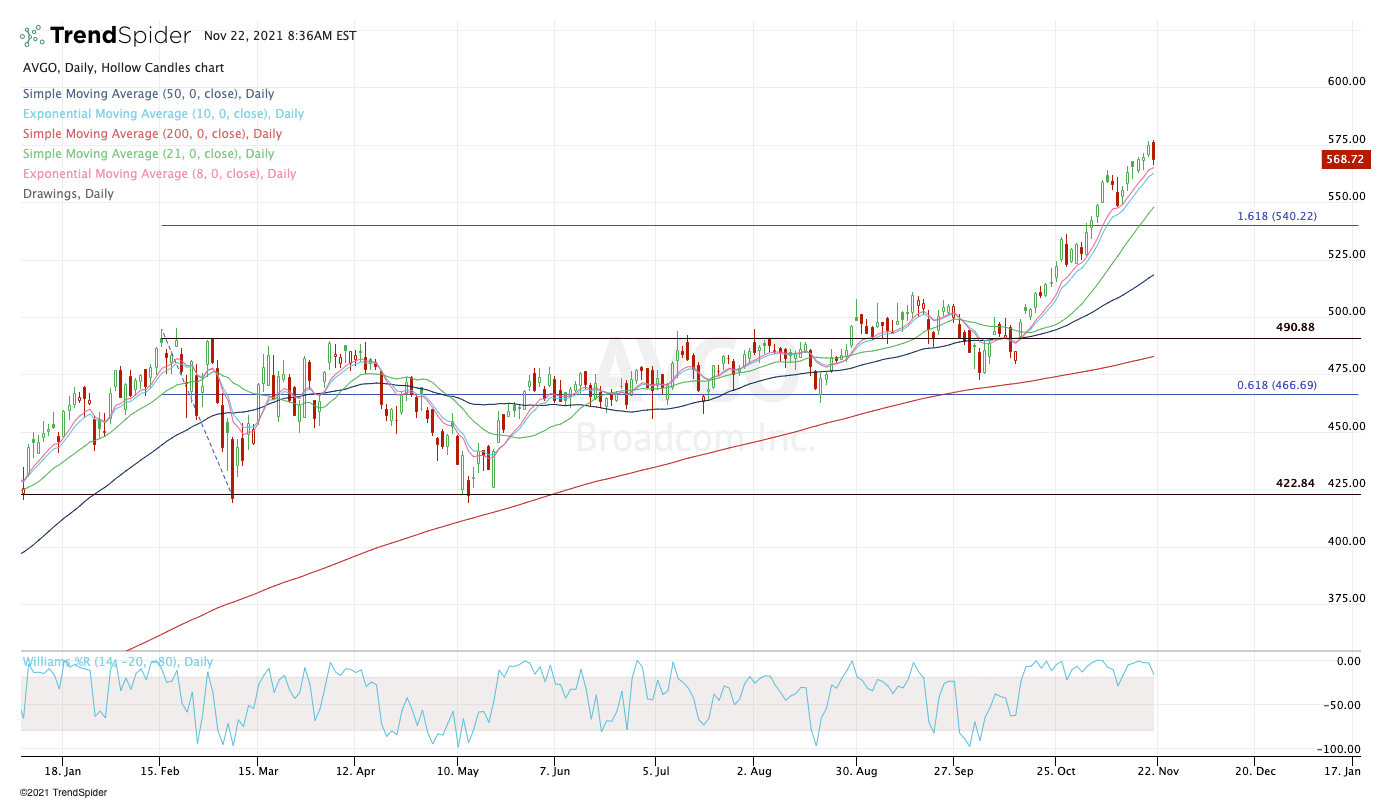
Nothing to say here but good. TTD, DOCN and AVGO have been great performers. Let’s see if we get a “reset trade” down to the 8/10-day moving average area for some buy-the-dip setups.
Other BTD plays I’m watching include:
JCI
SNOW
Disclaimer: Charts and analyses are for discussion and education purposes only. I am not a financial advisor, do not give financial advice and am not recommending the buying or selling of any security.
Remember: Not all setups will trigger. Not all setups will be profitable. Not all setups should be taken. These are simply the setups that I have put together for years on my own and what I watch as part of my own “game plan” coming into each day. Good luck!

Comments are closed