Our View
The markets have completely unraveled on Globex around 2:00 to 4:00 a.m. The Bank of England raised interest rates by 0.25% for the 5th consecutive time and said larger moves might be needed to tame inflation. Natural gas prices in Europe jumped as Russia cut supply again.
Those that have read the Opening Print know that I rarely change the ‘Lean/View’, but the ES made a high on Globex at 3833.50 and dropped 130+ points down to 3695. Regardless of what anyone says, these types of moves change things.
The Fed raised rates by 75 bps but said some things were out of their hands. For instance, they cannot control supply chain problems, commodity shortages, and higher fuel prices.
That all said, there is still over $3 billion in options expiring, which some think will rally the markets. According to the Stock Trader’s Almanac, the week of the June Quad Witching is usually down in a bear market, although Friday had the Dow up 10 of the last 19 occasions, (but down 6 of the last 7).
All of the above info is not very encouraging. I put my longer-term ES level out and 3600 is my next spot on the downside. Like I said last week, I thought things would start to accelerate and that the next leg down was upon us. Can the ES rally? Of course. Will the rally hold? Most definitely not.
Our Lean
Because we have come down so far overnight, perhaps some of today’s risk has been taken out of the market. Based on the price action, I think we can see higher prices. You can sell the early rips and buy the pullbacks or just be patient and buy the 50- to 70-point drops. I think the ES can eventually trade 3900 or higher and there are a ton of options that are going to expire on Friday.
Daily Recap
I was writing this for the recap yesterday: “It’s 12:30 ET and the Federal Reserve is about to raise interest rates by 0.75% in its race to stay ahead of a recession. The markets feel firm, but there has been big two-way flow all day and I think we could see some big 40 to 70-point moves.”
Little did I know when I wrote this there would be 70 to 100+ point swings coming.
The S&P 500 futures opened Wednesday’s regular session at 3776.25. After the open the ES dropped down to 3771.50 traded up to 3797.75 and sold back down to 3763.50 at 11:20 ET. Over the next hour it ground its way up to 3786.25 at 12:30 and then sold off down to a new low at 3752.50 at 1:00 and went into the 2:00 Fed announcement at ~3784.
First, the ES popped higher to 3803.50, taking out the session high. Over the next 7 minutes, the ES sold off 63.50 points to 3740 and came within a point of the Globex low. Remember, they like to run the stocks, but this is when the fun began.
From that low, the ES rallied 38 points up to 3778 and at 2:23, then pulled back 54 points to a new low of 3723.50 at 2:33. After the low, the ES rallied up to 3829.75, a 106-point rip in 13 minutes at 2:46. After the rip, the ES sold off 54 points down to 3775.50 at 2:58 just 12 minutes later. After the selloff, the ES chopped around until 3:15, before it surged another 60 handles up to 3843 at 3:35 — the session high.
We pulled back 34 points to 3786 as the 3:50 cash imbalance showed $3.4 billion to sell. The ES traded back up 3796, sold off down to 3786, and settled at 3794.50 on the 5:00 futures close, up to 53 points or 1.4% on the day.
In the end, as the PitBull said there was something for everyone! In terms of the ES’s overall tone, it felt like the ES wanted to go higher all day but the shakeouts in both directions were extreme. In terms of the ES’s overall trade, volume was brisk at 2.2 million contracts traded.
- Daily Range: 119.50 points
- H: 3843
- L: 3723.50
Technical Edge
- NYSE Breadth: 79.9% Upside Volume
- NASDAQ Breadth: 80% Upside Volume
- VIX: ~$32
I like to say, “The only day harder than Fed days are the day after Fed days.”
Sometimes, Fed days can be quite simple. If we barrel higher into them, they can become “sell the news” events. If the markets tumble lower, they become “buy the news” events.
The S&P came into yesterday decisively bearish and the market was busy discounting the higher 75 basis point hike. A rally was not surprising at all, as outlined in yesterday’s OP.
Now though, it’s tricky. What does the market actually want to do?
We saw something similar on May 4 — a nice post-Fed rally, then a 3-day, 333-point loss in the S&P.
Game Plan — S&P 500 (ES and SPY), XOM, MCK, AR, UUP
There are some individual names below, but we are still in a VIX $30+ tape. That means, no playing hero!
If the markets turn higher, some of these relative strength leaders could see a nice move. But if the markets don’t turn higher, do not get stuck in these stocks and saddled with unnecessary losses. It’s 8 a.m. and I have no idea what the market will be doing in three hours.
When in doubt, stay out — but keep these names on your screen.
S&P 500 — ES

You will notice something by looking at the chart above, which is that the ES did not close above 3807 yesterday.
It had a nice buy-stop run to the upside, but the ES couldn’t close above 3807. We were very adamant about that needing to happen for the bulls. In the O/N session, the ES ran the 3708 stops on the downside and we’re seeing a small bounce.
IF the ES can stay above 3708, I am watching a few areas on the upside: 3765 to 3770, 3786, then the pivotal 3807. If we clear the latter, then yesterday’s high is in play at 3843.
On the downside, simplicity wins again: 3708 must hold. Otherwise, the Globex low is in play at 3695 followed by a much deeper potential dip, with 3625 in play on the downside.
S&P 500 — SPY

Level to level is all that I’m saying here.
On the downside, a break of yesterday’s low at $372.12 puts the 2022 low in play at $370.59. Below the latter with a failure to bounce opens up a larger potential decline.
On the upside, the SPY needs to clear $380.54. Above it puts yesterday’s HOD in play near $384, followed by the gap-fill at $389.75.
XOM
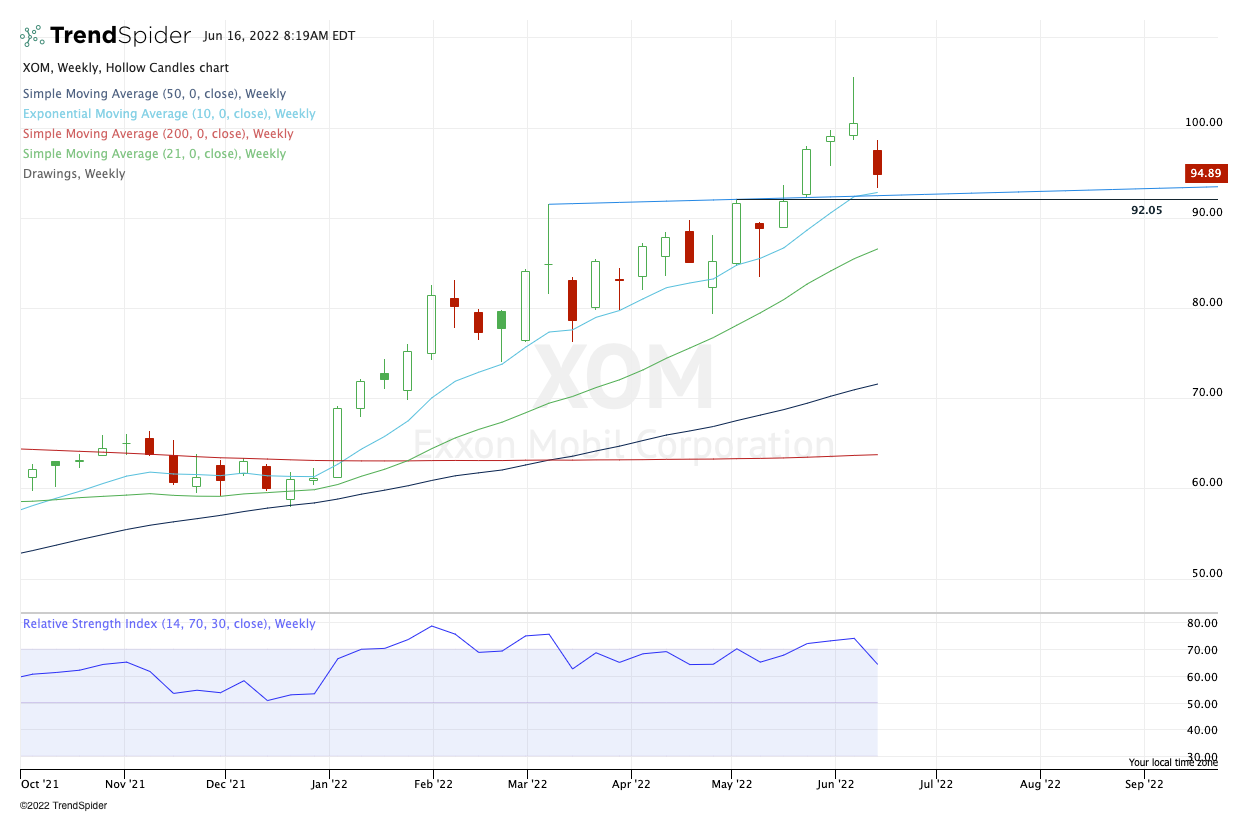
This comes with the enormous caveat that individual stock setups are tough at the moment, but at least for now, XOM remains in an uptrend. If it holds $92 on this morning’s dip, we could see a decent bounce.
The first target would be $97.
MCK

If it holds $300, it’s okay on the long side. Again with a weekly view, but don’t feel FOMO to get into these names. Index trades are still fine for now. So is doing nothing.
AR

That first trigger in AR came on a tough day in the market. For those that are long, see that AR holds this week’s low at $36.80.
For those wanting to be long, daily-up over $40 gives us a decent R/R.
UUP

I am still carrying a small UUP position, but we are dipping post-Fed — no surprise there — with the first area of active support at $27.75.
Consider some form of a “reload” there with some of the profits from our most recent/current trade in the name.
Go-To Watchlist — Individual Stocks
*Feel free to build your own trades off these relative strength leaders*
- Numbered are the ones I’m watching most closely.
- Bold are the trades with recent updates.
- Italics show means the trade is closed.
- DXY / UUP — I am down to just ¼ of a position here, as the response in the USD has been fantastic. One of the lone bright spots in a sea of red. → Can hold for a higher push here, potentially into the FOMC event, and use a B/E stop or cash out completely. $28.50 to $28.75 would be the final target area on this tranche.
Relative strength leaders (List is cleaned up and shorter!) →
- XLE
- AR
- XOM
- PXD
- DLTR
- AMD
- IBM
- ARCH
- NVA
- MCK
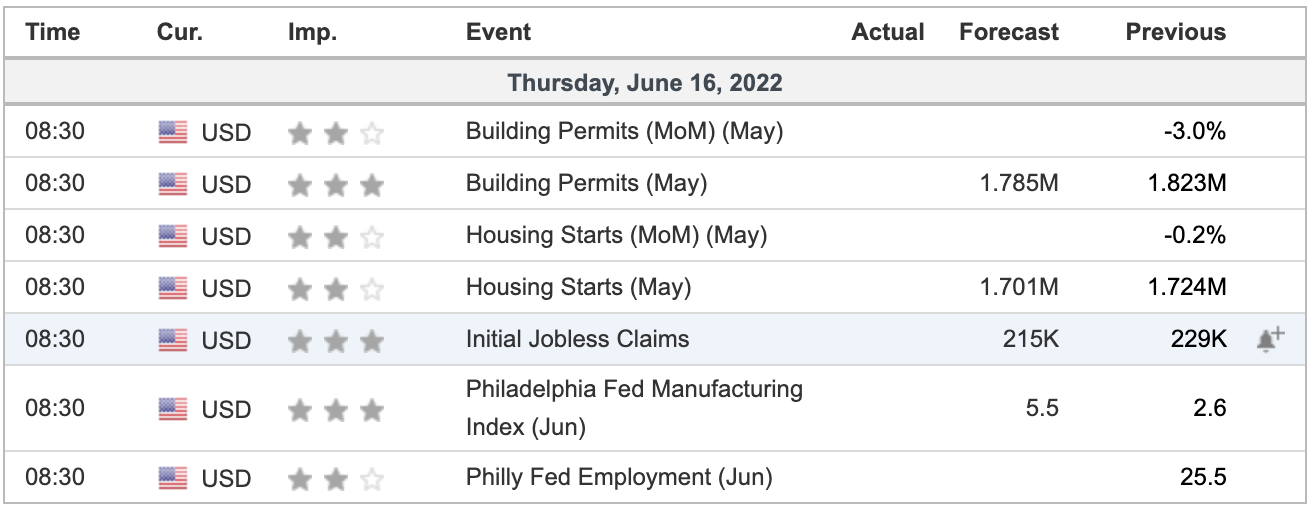
Economic Calendar
As we all know, there’s no crystal ball when it comes to trading stocks, options, or futures. But the Market Imbalance Meter may be as close as it comes. Knowing how the “Big Money” is placing its bets can give our trading room a big wave to ride — or a warning sign to stay out of the water. Come check it out now, risk-free for 30 days.
As we all know, there’s no crystal ball when it comes to trading stocks, options, or futures. But the Market Imbalance Meter may be as close as it comes. Knowing how the “Big Money” is placing its bets can give our trading room a big wave to ride — or a warning sign to stay out of the water. Come check it out now, risk-free for 30 days.
Comments are closed