How support is handled this morning will set the tone for this week.
Follow @MrTopStep and @BretKenwell on Twitter and please share if you find our work valuable.
Don’t Forget: The Long-term performance of the S&P 500, some longer-term setups, and 5 red flags that showed up before the 2022 bear market.
Our View
I want to talk about one thing very quickly, which is picking your spots. Last week we were buyers on Thursday morning and on Friday, we were taking profits. Even if that was your only one to two trades all week, then you did very, very well. Traders don’t need to take 20 trades a day to be successful. In fact, it is often a “less is more” approach that works better for most traders.
Keep that in mind this week.
Friday’s November Options expiration was short-lived for the bulls. There were two things working against the expiration: First, the gap up that used up a lot of buying power, and second, the Nasdaq futures — which has been the Achilles heel for the broader market — started falling.
It was easy pickins when there were zero borrowing costs, but the continued rate hikes and threats of more to come have spooked the technology sector and in turn, the broader market too. Despite the shortened holiday week, (markets are closed on Thursday and open for a half-day on Friday) will be overshadowed by the Minutes from the Federal Reserve’s November policy-setting meeting (due up on Wednesday).
For the most part, the ES ‘hung’ in a narrow trading range last week and I would like to think that will be the case during the shortened holiday week, but with an overload of economic reports, earnings, and the Fed minutes, that may not be the case. Last week was what the PitBull calls ‘water in the bathtub’ with the ES maintaining its current trading range and running both the upside buy-stops and the downside sell-stops.
Additionally, the volume has steadily declined from over 2.5 million ES contracts a day just a few weeks ago to Friday’s 1.47 million contracts traded. As the week rolls on, I expect volume to drop even further.
Our Lean — Danny’s Take

The VIX has fallen steadily over the last month and complacency has risen. Some think it’s a sign that the lows are in, but with the constant bombardment of the headlines and the reaction from the algos, there are still “mines left in the field.”
I think this will be a week to cut back.
Like always, I can’t rule out a rally but I still think you are supposed to follow the trend and sell the rallies. I think it’s just a matter of time before the ES starts going back down.
On the downside, 3930 to 3940 will need to be support early today for bulls to remain in active control. Below that opens the door down to 3916.
On the upside, 3962 has been overnight resistance. Above that puts 3975 on the table.
MiM and Daily Recap
| Up | Down | Net Flow | |
| Last 20 Sessions | 17 | 3 | $25.3 Billion |
| Last 10 | 9 | 1 | $18 Billion |
| Last 5 | 4 | 1 | $9.02 Billion |
The S&P had a total trading range of 51.50 points. It opened at 3990, up-ticked less than two points, and tumbled lower, bottoming at 3942.50 shortly after noon. At 3:50, the ES traded 3979 as the 3:50 cash imbalance showed $4 billion to buy. It traded 3973.50 on the 4:00 cash close and settled at 3971.50 on the 5:00 futures close, up 18.75 points or 0.47% on the day.
In the end, the market had a strong rally off the lows on Thursday but couldn’t follow through on Friday. In terms of the ES’s overall tone, it was weak out of the gate, then choppy through the rest of Opex. In terms of the day’s overall trade, volume was LOW, with 1.54 million contracts trading.
Technical Edge
- NYSE Breadth: 54% Upside Volume
- Advance/Decline: 59% Advance
- VIX: ~$24
S&P 500 — ES

Friday’s low is down at 3942.50, while the rising 10-day moving average is at ~3935.
Two tags of the 10-day in three days does cause the bulls to lose a little luster here. However, if we get a tag of the 10-day and then a reclaim of Friday’s 3942.50 low, it’s hard not to take a shot on the S&P here.
SPY — Daily
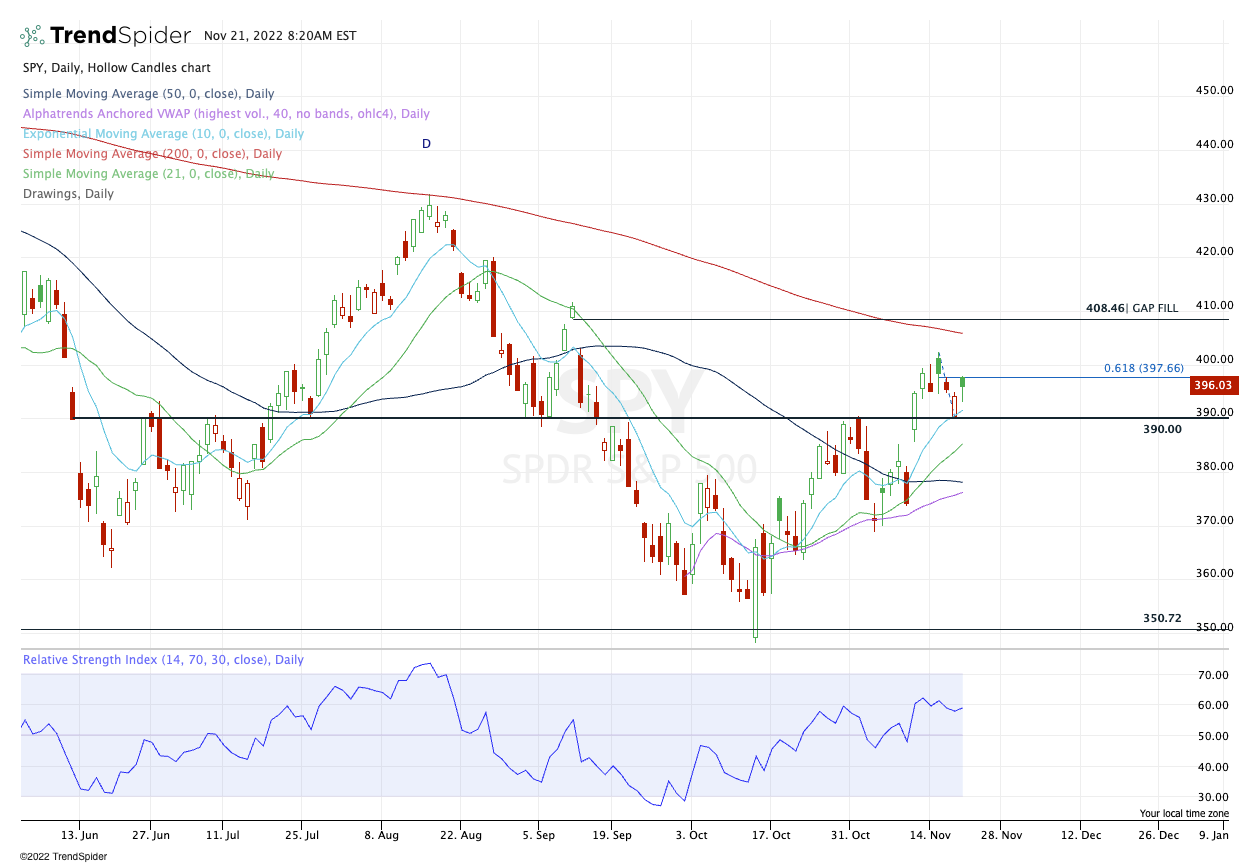
With the SPY, Friday’s low is around $393, with the 10-ema at $391.50.
If we get a dip down to the 10-ema, aggressive bulls can take a shot at it without the confirmation of the SPY reclaiming Friday’s low. As long as $390 holds as support, bulls are in control. It’s up to you to decide how much exposure you want, if any.
Gold — GLD
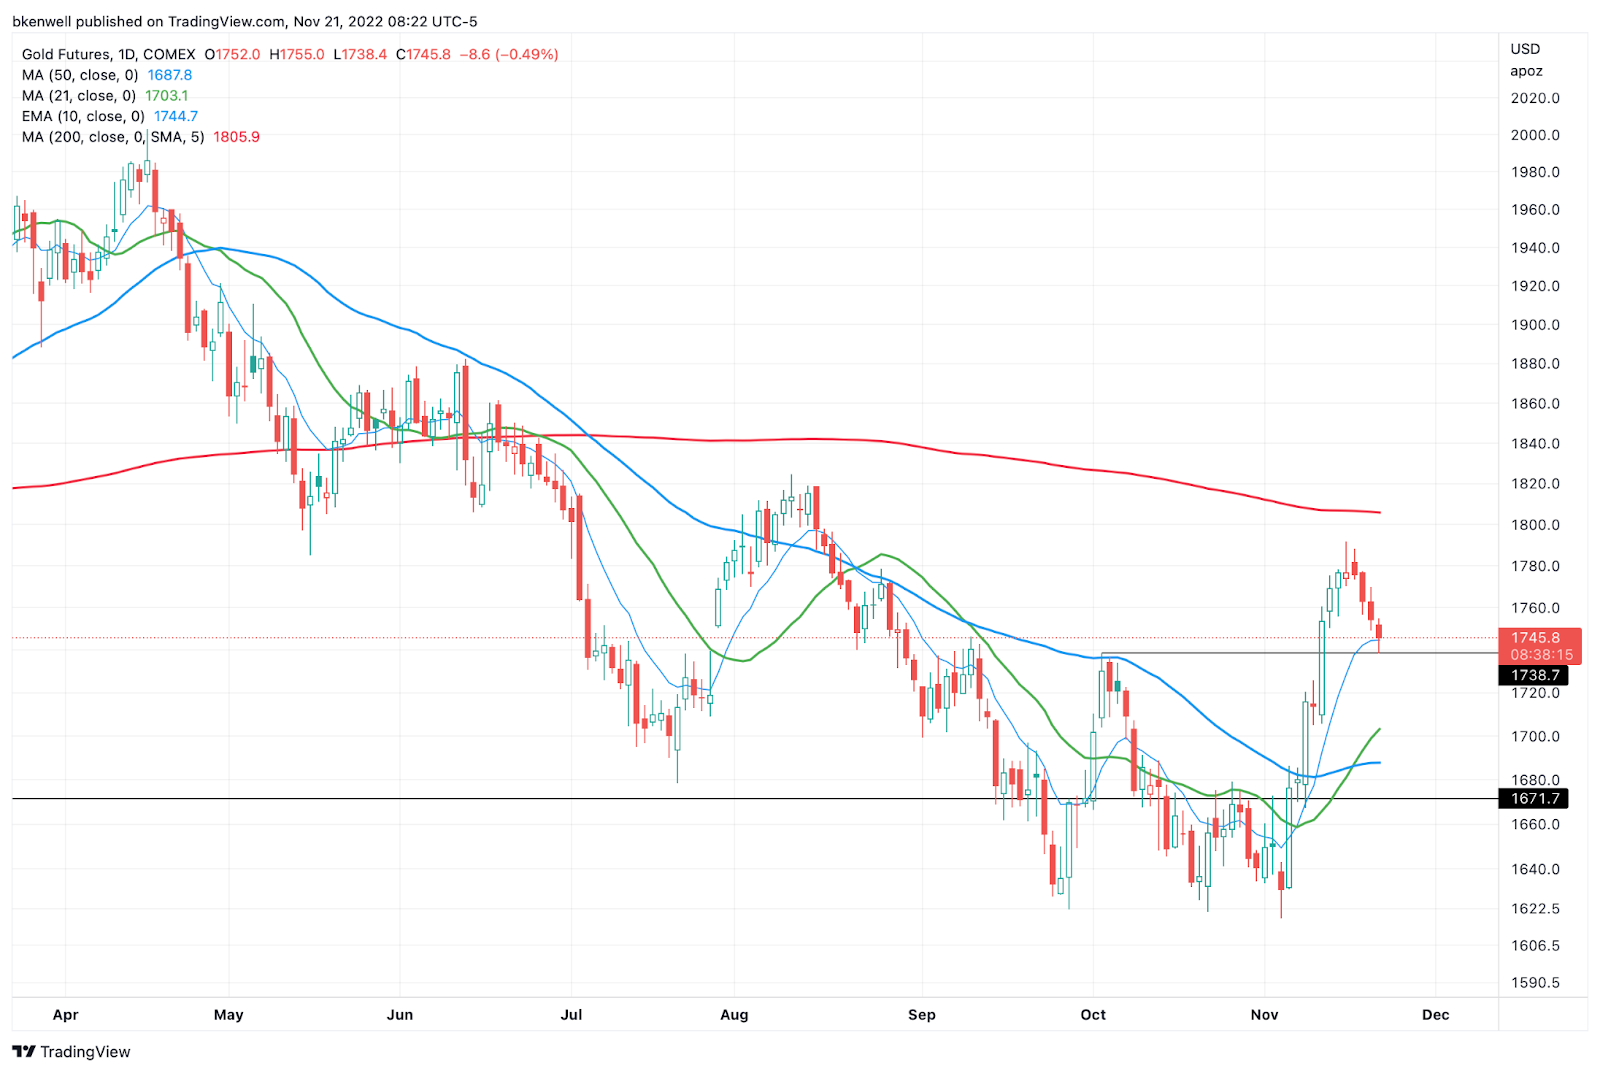
Last week, I said I preferred the daily setup on gold vs. the 4H setup, but regardless, here we are.
On the GC_F or MGC_F, gold is finding its footing right where it needs to: The 10-day moving average and the ~1740 level. A break of the low and failure to reclaim it opens the door to the 21-day moving average.
If it holds, let’s try and trim between 1765 and 1770.
Nasdaq — NQ

The setup we are looking for on the ES we already have on the NQ — that’s a dip below Friday’s low, tag of the 10-day and a reclaim of the aforementioned low.
This particular setup on the NQ allowed bulls to get long with ~12 points of risk and currently 50 points in reward. (I don’t like taking the same setup on the second go-around, as it tends to be weaker than the first. This is just to illustrate what I mean by “tag and reclaim”)
Nasdaq — QQQ
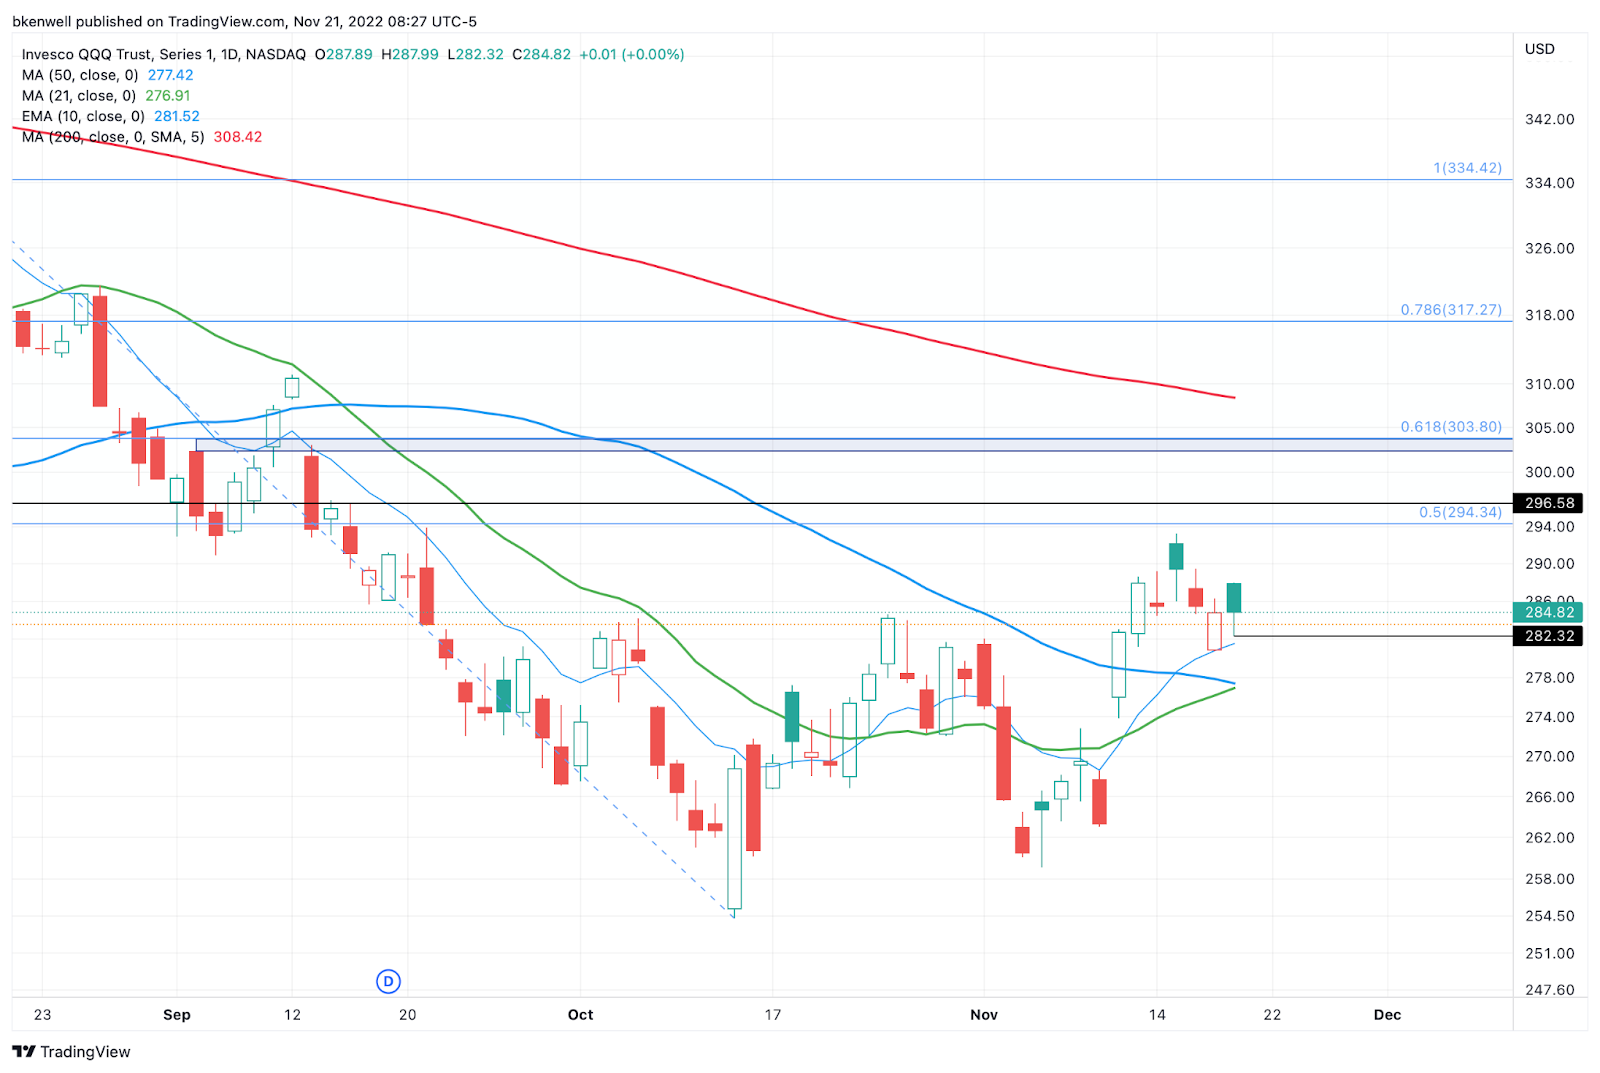
Keep an eye on $382.32.
That’s Friday’s low and if we get a break down and tag of the 10-day, look for a bounce back through this low. That could set us up for a cash-flow long trade.
Dollar
XX
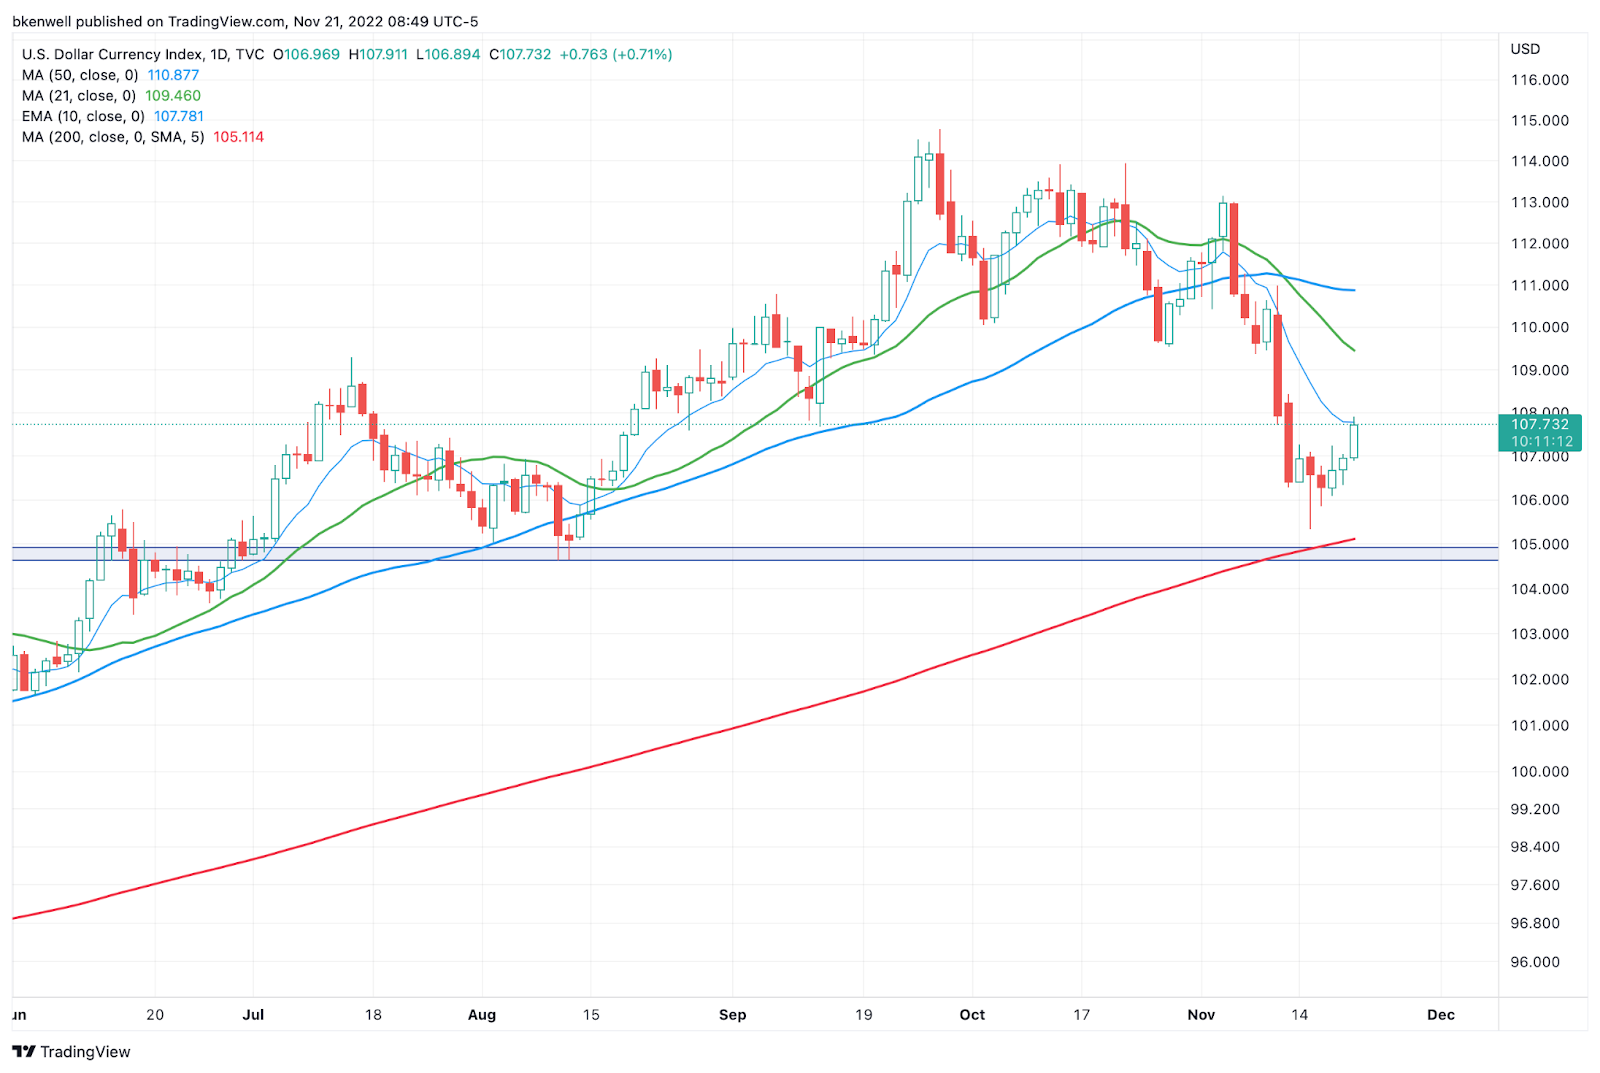
Above is the DXY, but it’s the same setup for the UUP ETF.
A run in the dollar is going to create a problem for equities. However, the dollar is running into active resistance via the 10-day right now.
If it’s resistance, then 106 or lower is back in play. If it’s not resistance, the DXY could run to 109.50. Even if you’re not trading the dollar, keep this setup in mind as it will impact equities.
Go-To Watchlist
*Feel free to build your own trades off these relative strength leaders*
- Numbered are the trades that are open. g
- Bold are the trades with recent updates.
- Italics show means the trade is closed.
Open Positions
- TLT — Trimmed into the $100s yesterday. Should be down to ½ or ⅔ positions from here. If it’s got real strength, it will hold $100 as support, and push into $104 to $105 next. B/e or better stop.
- CCRN — down to ⅓ or less & raise stops.
- QQQ — down to ⅓ or less & B/E stop
- DIA — down to ⅓ or less & B/E stop
Relative strength leaders →
- LNG
- CAH
- TJX — new highs
- SBUX
- AMGN
- CCRN
- REGN
- CI
- MCD
- ENPH, FSLR — solar has strength
- VRTX
- UNH
- MRK
- XLE — XOM, CVX, COP, BP, EOG, PXD
- SBUX
Economic Calendar

Comments are closed