Our View
The Nasdaq closed down 1.1% and finished yesterday’s session 10.7% below its closing high set in November and is down 8% year to date.
Despite the bond market closing higher and the yield on the 10-year note falling to 1.826%, it was not enough to stop the Nasdaq from falling into negative territory. Gold futures climbed 1.7% up to $1,843.20 and crude oil settled near a 7-year high.
So what’s the deal?
Well, rates were the leading headwind and now they’re throwing in geopolitical issues with Russia and Ukraine.
Our Lean
Our lean, I was right about the early buy-stop run but I was wrong about the 100-point move. One of my weaknesses is thinking the ES can continue to rally after it already has.
We wanted to buy a gap-down yesterday and once it gapped up and held for the first 30 minutes, it made things tricky — it made it seem like it could keep going.
The current price action is a series of failed rallies. In other words, dead-cat bounces which have been selling opportunities all year.
The trend is your friend and right now that trend is down. You can buy the early dips and sell rallies or just sell any 30- to 40-point rallies. I know the ES is overdue for a big rally, but the price action speaks for itself: The ES just can’t hold.
Should the ES take out the 4500 level and the December low at 4492, the first area on the downside is the RTH gap at 4470.50. That’s also the breakout level from October.
Daily Recap
The ES sold off down to 4535.50, opened Wednesday’s regular trading session at 4588.50, and rallied up to 4601 at 9:39. The near-70 point rally wasn’t enough, though.
After the push, the ES pulled back to the 4593.50 level then traded up to the high of the day at 4603 before dropping ~40 points down to the 4562 area. From there, the ES gave bulls a mild bounce back up to 4573 at 10:45 — last week’s low — and was rejected, rolling over to a new session of 4554.25 at 11:20.
Just as it was rejected by last week’s low, yesterday’s low acted as support in this area. It allowed the ES to find its footing and begin to rally, climbing about 33 handles off the low and rallying to the 4585 to 4588 area around noon.
However, the ES was trapped in a narrow 7- to 10-point range until it broke down to 4567.50 at 1:54 and ultimately broke to new lows of 4549.25 at 2:40.
The ES then stutter-stepped up to 4568 at 3:15 and got hit by another wave of sell programs down to 4542 at 3:40 as the early MIM showed $445 million to buy. It didn’t matter, as the bids just kept getting whacked. The ES traded 4542 as the 3:50 cash imbalance showed $1 billion for sale, and traded 4524.75 on the 4:00 cash close.
It dipped more after the close but rallied back to settle at 4524.50 on the 5 p.m. futures close.
In the End
In the end, I didn’t get my 100-point rally but the future did rally 67.5 points from their Globex low before reversing sharply, with the Nasdaq leading the way lower.
In terms of the ES’s overall tone, it was another day of selling the big dead-cat bounce. In terms of the ES’s overall trade, volume was high at 1.927 million contracts traded.
As we all know, there’s no crystal ball when it comes to trading stocks, options, or futures. But the Market Imbalance Meter may be as close as it comes. Knowing how the “Big Money” is placing its bets can give our trading room a big wave to ride — or a warning sign to stay out of the water. Come check it out now, risk-free for 30 days.
Technical Breakdown
- NYSE Breadth: 68% Downside Volume
- NASDAQ Breadth: 68% Downside Volume
Even though we got exactly what we were looking for yesterday — a mild gap-up that was sold into — it still wasn’t easy to navigate. The markets were slippery going into the close yesterday, ending the session near the lows.
However, traders are again being greeted by a gap-up this morning. It has similar feelings to yesterday, which were:
“A mild gap-up after a big down day is not ideal. I would rather have a gap-down today, which stretches the rubberband too far and creates the opportunity for a snap-back rally.
Instead, a gap-up just gives the sellers more ammunition to sell into — which is what we may look to do as well. Still, I want to refrain from getting too bearish after such a notable downside move.”
Game Plan
I don’t want to be a blind and stubborn short. Meaning, I don’t want to be a constant seller and I do feel that we are due for a bounce at some point. However, these gap-up opens make it hard to be a buyer.
If we are looking for a bounce in the ES/SPY and it already comes in higher by 40 to 60 basis points, it’s tough to get long on that because the risk becomes substantially larger.
The Trade:
- If the ES/SPY fades from the open, I am going to keep an eye on yesterday’s low. A break below and a reclaim back above could give bulls a low-risk long trade.
- If we gap-and-go, I will keep an eye on the $455 area in the SPY and the 4560 area in the ES (I’ll explain why below).
- If we lose yesterday’s low and can’t reclaim it, the December low is likely on the table.
I felt more confident about fading yesterday’s open than I do today. It doesn’t mean it won’t happen, but I feel more comfortable waiting for either a higher-odds selling opportunity ($455 to $456) or a low-risk buying opportunity until the market has shown more of its hand.
S&P

Again, I don’t want to sound like some kind of perma-bear here and my general feeling is that that’s not the case. However, until the S&P can make some headway on the long side, the easier trade is on the short side.
So why am I watching the $455 to $456 area in the SPY and ~4560 in the ES?
$455.54 is the 50% retracement of yesterday’s range, but as you can see by the H4 wicks this week, that area has also been support. When you lose prior support, it has the potential to turn into resistance.
Just above $456.50 is the last week’s low, the 200-unit SMA on the H4 chart, and the 21-week moving average.
As I said, I’m not a perma-bear but the number of overhead levels is piling up. If the S&P can clear all of these levels, then bulls may have a larger bounce in the making.
Nasdaq is in Correction Territory

My how a gap-down open to the 200-day would have made the QQQ an attractive long today. Instead, it’s up about 75 basis points in the pre-market and running into last week’s low.
That’s a bit of a caution flag for me and would actually have me looking at selling it if it fails to hold a reclaim of this mark ($369.31).
As for the NQ, it actually did give us a test of the 200-day, which came early in the Globex session. For the NQ, keep an eye on last week’s low, at ~15,163. Above it is good. Below suggests some caution.
Individual Stocks
For what has been such a tough week, we have actually navigated it pretty well IMO.
The BAC post-earnings fade worked well. So did the FAST fade, for those that took it. And we sold the SPY (here’s a pretty good synopsis).
As for the AAPL trade…we need to see it reclaim last week’s low. Although, even if it does, it leaves us with ~$2.25 a share in risk. Meaning we need a pretty meaningful bounce to justify a long position. To me, that means smaller position size or skipping the trade altogether.
It did reclaim the $168.17 trigger briefly on Wednesday, but couldn’t hold it late in the day, which kept me from carrying it overnight.
I also tried a long Ford position, given that it has been on our Go-To list for a while. That one did not hold up well at all, unfortunately. Although it does look like it will fill the gap this morning.
Go-To Watchlist
- Energy (PXD, DVN, SLB, COP, CNQ and XOM)
- TD, MET — TD willing to buy the dip to the 10-day if we get it today.
- ABBV (watching weekly more than daily, daily still needs some time)
- QCOM — nice weekly chart. b
- CAT
- DE
- BRK.B
- KO
- PG (great EPS follow through)
Tesla

Gapping up on the day, let’s see how TSLA handles the $1,015 area — the two-day low prior to yesterday’s fall. I want to see if it’s reclaimed or rejected.
Below $1,000 keeps last week’s low in play. Above $1,016 could put $1,040 in play.
AMD
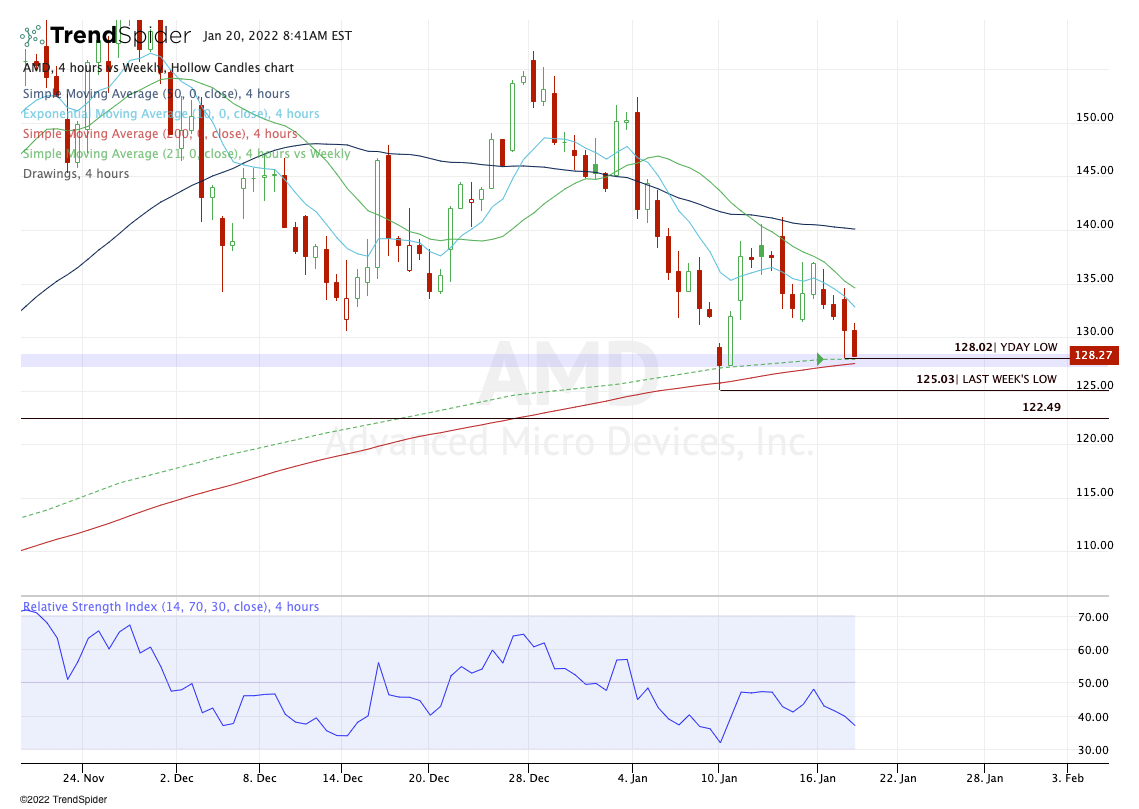
Despite all the gap-ups, AMD is gapping down on the day, currently changing hands around $126.50.
I am watching two levels here. The first is ~$125, which is roughly last week’s low. A break of this low and a reclaim could give us a potential high R/R long setup.
On the upside, watch ~$128, which is yesterday’s low. A quick reclaim of this area could also give us a long trade — one we nailed just a week ago. That puts $130 in play, followed by $132.50, then potentially $134.50 to $135.
However, see if this $128 area is resistance and struggles to be reclaimed. Not only is it yesterday’s low, but it’s also the 200-unit SMA on the H4 chart and the 21-week moving average.
We want a quick reclaim and hold of this level, otherwise, it runs the risk of rejection.
Energy

Is it finally time for this Relative Strength leader to rest? Notice how oil prices climbed yesterday (left), yet energy stocks fell (right).
We could see a type of rotation perhaps, as a bounce in tech and a dip in energy? Regardless, we want to look at potential dip-buying opportunities in the latter.
I am using the daily chart above but feel free to zoom into an hourly or H4 chart when looking at the sector (XLE) and/or some of the individual names listed above.
Disclaimer: Charts and analyses are for discussion and education purposes only. I am not a financial advisor, do not give financial advice and am not recommending the buying or selling of any security.
Remember: Not all setups will trigger. Not all setups will be profitable. Not all setups should be taken. These are simply the setups that I have put together for years on my own and what I watch as part of my own “game plan” coming into each day. Good luck
Economic Outlook

Comments are closed