We have the Fed on Wednesday. Buckle up until then.
Follow @MrTopStep and @BretKenwell on Twitter and please share if you find our work valuable.
Our View
The FedEx profit and global recession are ominous signs. Even if it ends up being a company-specific issue, the news comes at a concerning time.
Others are struggling, too. Goldman Sachs says it’s going to cut its workforce and over 42,000 U.S. tech sector employees have been laid off so far in 2022. The list seems to get longer by the week.
This is a real look at how the global economies are not just slowing, but shrinking. Although the damage does seem to be having an outsized impact on tech (just look at the jobs reports), these things tend to take time to creep through the system.
How bad is it? The Nasdaq futures had its worst week since January, down 5.8%. All three indexes are down in 4 of the past 5 weeks. If you think this is going to get easier, think again. This week is the two-day Fed meeting, with estimates giving us an 82% probability of a 75 basis point increase on Wednesday.
Our Lean — Danny’s Take
The big summer rally in the S&P offered the bulls a glimmer of hope, but that rally has fizzled out. Now the bulls are fighting for their lives.
I keep telling myself and the PitBull that we are outgunned and that you have to get up from the desk because watching all the stupid buy and sell programs eventually means you will change your mind and get crossed up on the trends. Pick your levels carefully, use stops, and don’t stare at the screens.
Our Lean: The ES fell to 3853 on Friday then rallied 50 points off the low and closed at 3890. In most cases, I would say that’s a bullish pattern, but up so far from the low sets us up for another dip in a tape like this.
A few months ago the public thought the Fed was behind the 8-ball and now traders think they may overshoot. Personally, I don’t think it matters either way… inflation is here to stay. A full point seems like too much, but somehow 75 basis points feels inadequate.
Our lean is to continue to sell the rallies. That doesn’t mean I wouldn’t buy a dip for a scalp, but I don’t think the low of this move is in.
Daily Recap

The ES traded down to 3923.25 on Globex and opened Friday’s September Quadruple Quad Witching expiration at 3874.50. The ES made a high after the open at 3879.25, sold off down to 3864, rallied up to a lower high of 3875.50, and traded down to 3853.50 right into 10:00.
After the selloff, the ES bounced up to 3886.25, traded down to 3870, then popped up to 3891.75 at 10:39. It was that high that set up the dropped down to 3853 at 12:28, rallied back up to 3869.25 and dropped back down to the 3859 level. After some back-and-fill the ES rallied up to 3870.75 and traded back down to the 3956.50 level at 1:57, did another round of back and fill, and in a 1 min bar rallied 15.50 handles up to 3993 at 3:22 and then dropped back down to the VWAP at 3873.75 after the low print.
Over the next 10 minutes, the ES slowly traded back up 3892.50 at 3:41, pulled back down to 3881.50 at 3:48 and traded 3884 as the 3:50 cash imbalance showed $1.1 billion to sell imbalance showed, and traded 3888.75 on the 4:00 cash close. After 4:00, the ES traded up to a new high at 3903.50 and settled at 3902.50, down 7.5 points or +0.19% on the day.
In the end, the ES did sell off, but it held the 3850 area and settled above 3900, a good day for the bears but a somewhat positive close. In terms of the ES’s overall tone, it was a brutal day of chop. In terms of the ES’s overall trade volume rang in at 2.61 million on account of big expiration day.
- Daily Range: 52 points
- High: 3905
- Low: 3853
Technical Edge
- NYSE Breadth: 18% Upside Volume (!)
- NASDAQ Breadth: 22% Upside Volume
- VIX: ~$27.80
Game Plan: S&P, Nasdaq
Despite Friday’s big rally off the low, the S&P and Nasdaq still closed lower on the day. Worse, the weekly candle was quite destructive from a technical perspective.
Even with Friday’s late-day rally, we still ended with an 82% downside day on the NYSE.
And so castles made of sand
Fall in the sea eventually
-Hendrix
S&P 500 — ES

I can’t help but notice how Thursday’s low of 3905 was also the high from Friday. Granted, one could say it’s Friday’s Globex high (it was), but it also climbed to 3903.50 into the close — close enough, I say.
The action remains bearish and as you can see on the 30-minute chart above, the ES is clinging to Friday’s low.
If it can hold these levels, I think we could see a rally to the 3875 to 3880 area in the opening hour of trading. Above that does put the ~3900 area in play, but I would first look at the 3875 to 3880 area as resistance.
A break of ~3850 and traders must watch this level as a potential pivot zone. If it breaks and acts as resistance, lower prices are in store.
ES — Daily

Remember a few weeks ago when we were talking about the 4000 area in the S&P? It had all of the levels for support…VWAP from the lows, the 50-day moving average, 50% retracement, etc.
But then day by day, the ES whittled those levels down and failed?
It’s like that again. 3900 was a big support level and it just vanished on Friday. Bulls are still grasping at straws here, looking for some type of low.
I’m no perma-bear. I’m really not. I don’t like bear tapes. They are unpredictable and volatile; they’re a drunkard. A low-vol, bullish uptrend is far easier. But we have to navigate the environment we’re given.
If the ES can reclaim 3900, longs have something to work with. A sustained move below 3853 (Friday’s low) and I think we can see more selling pressure. Ideally, that means 3750, but 3790 comes first in that scenario.
Longer term and a test of 3500 to 3600 would be ideal.
SPY

Uptrend support = broken.
$390 support = broken.
What exactly are bulls clinging to here in the short term?
Maybe a break and reclaim of Friday’s low at $382.11 works for a cash flow trade, but as it stands, we’re on the cusp of a weekly-down rotation following a bearish engulfing candle on the weekly chart.
A break of $382.11 that isn’t reclaimed ushers in the $379 gap-fill level, then the $372 to $374 support area from July.
Nasdaq — NQ

One scenario developing for the NQ is an “ABC” correction back down to the low 11,000s.
That’s negated — or at the very least, delayed — if it can regain the 11,930 to 12,000 area. Daily-up over 11,960 would be encouraging for the longs, but I’m not holding my breath at the moment.
QQQ

The QQQ needs to regain the $290 to $291 level. If it goes daily-down below $285.62 and can’t reclaim it, then $283 could be in play.
TAN
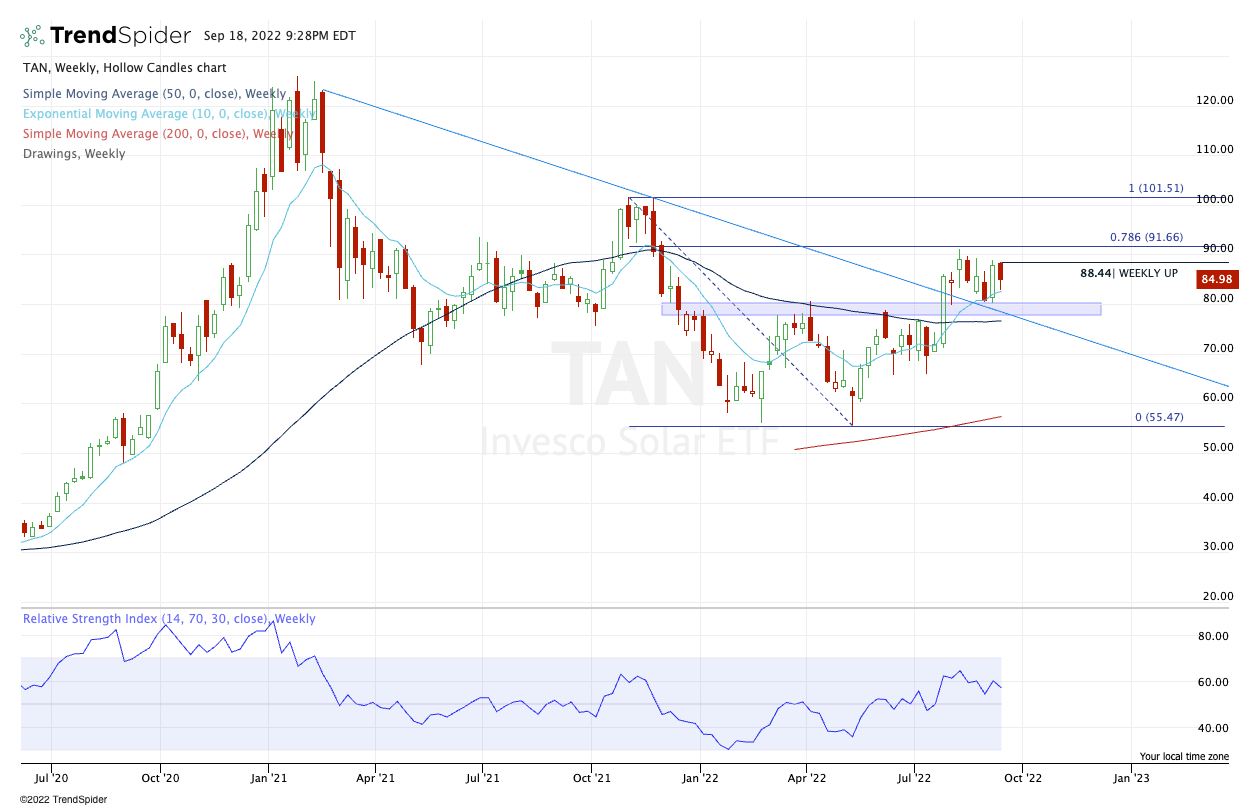
I’ll be honest. I’m not in much of a “buying” mood down here when it comes to a trade. That said, solar stocks have been on fire and TAN just gave us a really nice consolidation look and an inside week.
If we can get an inside-and-up week over $88.50, I’m potentially interested in a ½ position. Otherwise, focus on the indices.
Go-To Watchlist — Individual Stocks
*Feel free to build your own trades off these relative strength leaders*
- Numbered are the ones I’m watching most closely.
- Bold are the trades with recent updates.
- Italics show means the trade is closed.
Notes:
- UUP — Down to ¼ position as we hold for potentially higher prices. Raise stops to $28.40 to $28.50. Look for $30 on the last piece.
- CHNG — Consider taking the last piece off at $25.75 to $26 or simply hold against a B/E or better stop and ride the trend higher. #Kudos
- OXY — Stopped
Relative strength leaders →
SOLAR remains such an area of strength.
Top:
- TAN
- ENPH
- FSLR
- LNG
- CAH
- F
- XLU
- XLE
- OXY
- BMRN
- PWR
- CHNG
- CELH
- COST
- UNH
Economic Calendar

Comments are closed