Don’t Forget: Fed Minutes at 2 pm
Follow @MrTopStep and @BretKenwell on Twitter and please share if you find our work valuable.
Don’t Forget: The Long-term performance of the S&P 500, some longer-term setups, and 5 red flags that showed up before the 2022 bear market.
Our View
While the ES (-0.70%) and NQ (-1.0%) were weak, the YM +0.1% wasn’t. Clearly, there was a rotation out of the S&P and tech into the Dow. Yesterday’s volatile trading got a kicker when Bank of England Gov. Andrew Bailey said that its plan to rescue pension funds will end on Friday, as scheduled.
The markets took Bailey’s comments as a negative due to concerns about further asset sales by U.K. pension funds in the face of large interest-rate increases. “They have got three days” isn’t exactly a reassuring comment from Bailey and does not send a calming message to investors.
The VIX jumped up to $34.43 just after 2:00 but pulled back down to close at $33.36, up 1.3% on the day. Large moves in the VIX are sometimes a warning of a large move to come.
I want to be careful how I word this — because it may not pan out and there will be rips and dips along the way — but I told Bret that I think it’s possible for the ES to drop another 10% to 15% by year’s end.
I continue to think of two things.
- The markers continue to act “disjointed” and I have held that stance since Q1. It’s not because I’m stubborn, but because I’ve seen many bear markets over the years and the problems causing this “disjointed” action haven’t gone away (Russia/Ukraine, hawkish Fed, high inflation, and now worries in the UK/Europe).
- I think something bad is going to happen. I know this is not what most readers want to hear, but with the ongoing mass liquidation, being in Q4 and the concerns surrounding financial market mechanics increases the pressure that “something will break.”
- Whether it’s related to the UK pension situation, a currency problem, Credit Suisse, etc. — I’m not sure, but the “concerns are concerning.”
Another thing — and I have not heard this out of PitBull since the 2008 credit crisis — the brokerage firms are having a tough year. They are making money on their ‘market making’ but the customer trading business is way down. Margin rates are up, but traders are blowing out left and right.
But can the ES put together a rally today? There is a chance.
Our Lean — Danny’s Take
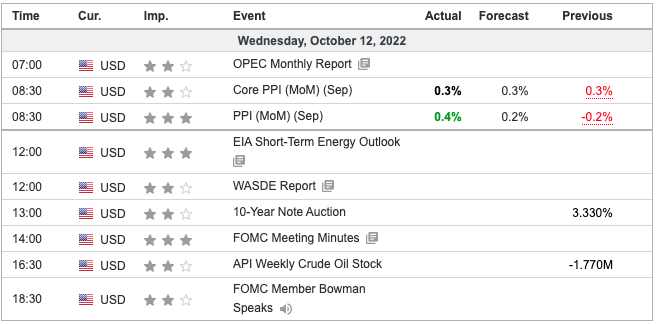
PepsiCo reports this morning and BlackRock, JPMorgan, and Morgan Stanley report later in the week. Today we get the PPI numbers and the Fed Minutes at 2 pm, then tomorrow is the dreaded CPI print.
Our Lean: I get the feeling that markets could rally today. The YM told the story yesterday and on Globex last night. If the number knocks the ES down in the morning, we may be able to buy a lower open. There are so many buy stops above that if the ES gets going, it could easily rally sharply. The markets are flashing caution to the shorts as the S&P is down in 5 straight sessions and refusing to collapse.
That said, I’m not sure how this all going to play out today and just because some sort of bear market rally could occur today/tomorrow, doesn’t mean I’m bullish. Our plan to sell the 40 to 60 points rallies worked wonders yesterday, even with just a 1-lot on the ES.
And I think traders can continue to sell the bigger rallies, but just because these 4-6 down days in a row can suck traders in on the short side, then crush them when they run the upside buy-stops.
If we lose 3580 and can’t regain it, then the ES is toast.
Daily Recap

The ES traded 3628 at 8:30, then opened 3605 an hour later and spilled down to 3580 in the opening 30 minutes. It found support, and went on a huge rally, climbing 58 points shortly before noon, pulled back 20 points, and then jumped another 36 handles to the regular session high at 3653 at 12:45.
The market entered a choppy back-and-fill favoring the downside until 2:40. That was when the market collapsed more than 60 points following comments from the BoE. Ultimately, the ES bottomed at 3579 and bounced into the close.
The ES traded 3602.75 as the 3:50 MIM reading showed just over $1B for sale and the S&P traded as low as 3591 before closing at 3599.75 at 4:00 and settling at 3608.25 at the 5:00 cash close.
In the end, it felt like a “bend don’t break” trade as the ES continued to hold 3580. In terms of the ES’s overall trade, 2.345 million contracts traded was the second-highest one-day total this month, but still below the 20-day average of 2.39 million.
Technical Edge
- NYSE Breadth: 36% Upside Volume
- Advance/Decline: 42% Advance
- VIX: ~$33.30
(There are a few individual stock setups under the Go-To Watchlist section).
Game Plan: S&P, Nasdaq, Bonds
The PPI numbers were not what bulls were looking for, but so far, the market isn’t breaking.
The dollar is popping on the news, but not exploding. Bonds are dipping but not crashing. That leaves the range-trade in play for the S&P.
The 2 pm Fed minutes may shake that up, but as it stands, here we go:
S&P 500 — ES
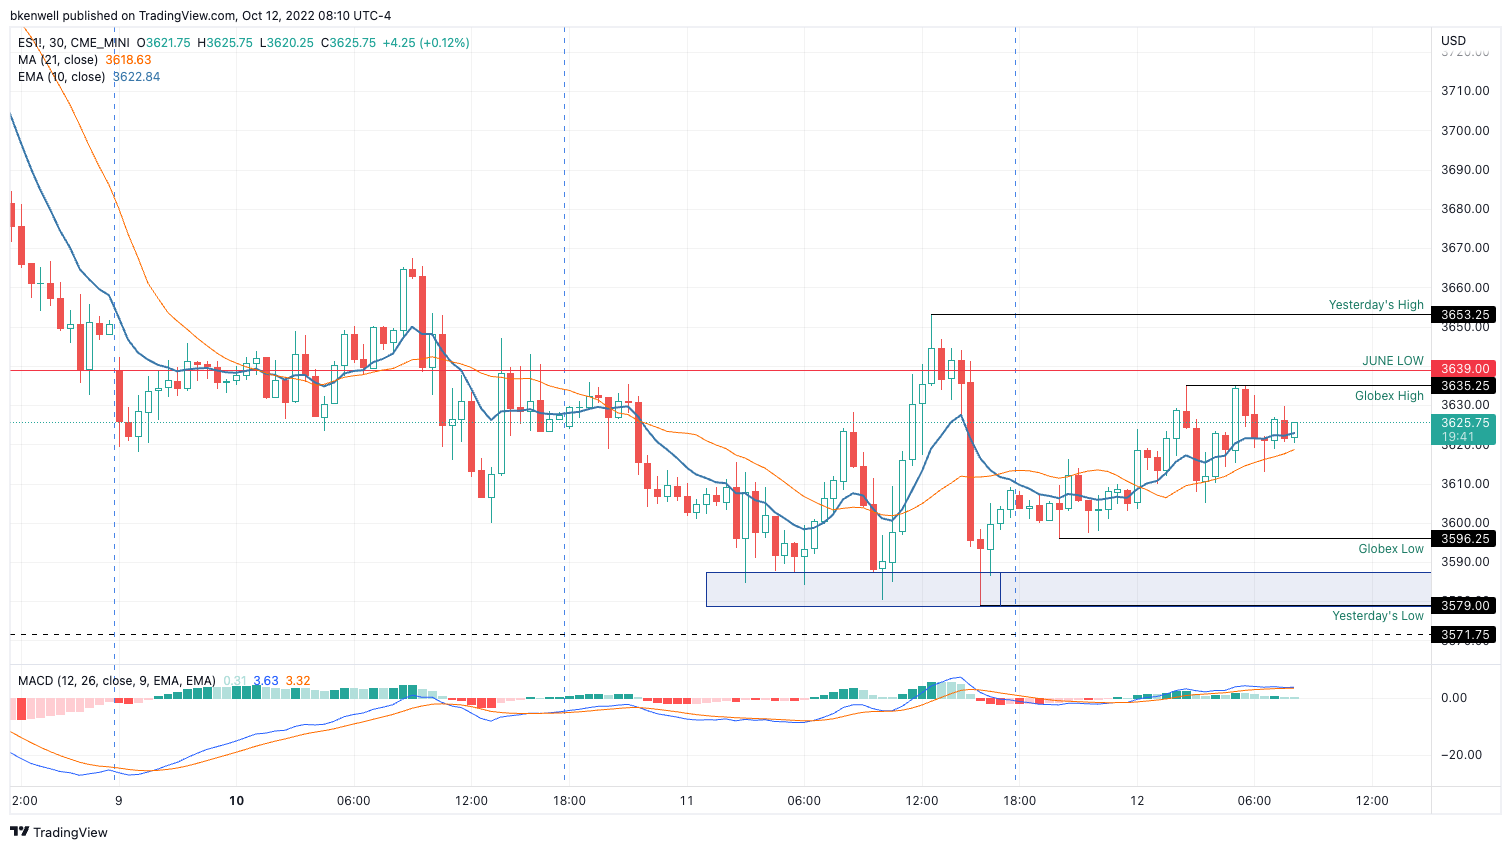
After five straight daily declines, the ES keeps finding its footing in the 3580-ish area.
Traders on both sides of the ball need to respect and recognize that. If this area breaks and then becomes resistance, then the bears can seize more control.
However, if the ES can clear the June low and take out 3650, then we could see the market squeeze out some of the weak hands on the short side.

Notice that the ES continues to build below 3650.
That’s not bullish price action really, but for shorts, it has to be concerning that they can’t crack 3580. When a move takes too long, complacency builds. It doesn’t help that we’re coming into a binary situation — PPI and Fed Minutes today and CPI tomorrow.
Over 3650 without reversing puts the 10-day ema in play, then potentially 3725 to 3750.
Below 3571 is a big concern unless bulls can reverse it.
SPY

Another 30-minute chart of the SPY and you can see how that tight range is building.
Long-time members know my vocabulary of “deliberate price action” as the SPY deliberately stayed below the June low yesterday. At the same time, it continues to hold the $355.75 to $356 area.
Keep this fucking simple, traders! Ultimately, we need a range break.
If support breaks and isn’t reclaimed, the low-$350s could be on tap. If resistance breaks and doesn’t reverse, then the SPY can fly and maybe that gap-fill from Oct. 7 is in play up near $372.75.
Otherwise, we need to respect these levels until they break.
Nasdaq — NQ

Trading is not easy, but it can be simple.
11,040 to 11,070 is the upside area for bulls to break. If they can do it, 11,200 to 11,250 is in play, which is the declining 10-day ema and the 50% retracement of this decline.
If bulls can’t break that 30-point range between 11,040 and 11,070 then bears remain in control.
CEG

Let’s see if the $82 area and the 50-day can give this a bounce. A lower volume name and VIX is $30+ so as always, more risk protection and smaller size if still looking at individual setups.
Go-To Watchlist
*Feel free to build your own trades off these relative strength leaders*
- Numbered are the ones I’m watching most closely.
- Bold are the trades with recent updates.
- Italics show means the trade is closed.
Notes:
XLE — Set to open lower, let’s see if we see $78 today for a chance on the long side.
- FSLR — those who didn’t get a chance on Monday got there chance to get long yesterday and we got the $132 to $133 trim zone. Can go with a B/E stop loss here.
- Conservative traders can look for $135.50 to $138 as the next trim. More aggressive traders can fish for $140.
- XLE — Didn’t quite get the $78 level, but we got the 10-day ema, which was the goal. Traders can use a stop-loss near $76 for a tight trade. I would trim ⅓ on any push over Tuesday’s high of $80.85.
Relative strength leaders →
Top:
- LNG — nearing the breakout near $150
- MCK — Stopped earlier but still holding the breakout near $340
- CAH — Just Robust
- LPLA
- CCRN
- FLSR
- ALB
- VRTX
- CYTK
Economic Calendar
Comments are closed