Our View
Gold nears potential support
Clearly, the dog days of summer have started early. The ES has rallied almost 7% in the last five sessions and is ‘dragging’ against the NQ (up 9%). The Fed meeting is next week, but I think we could be setting up a summer range trade. Most of the dip buyers are underwater and the sellers seem to have run out of bullets.
So where does that leave us?
Right now all four US indices are up two sessions in a row and at the highest levels since mid-June. One of the things I think is helping drive the markets back up is the big bounce in the 10-year and 30-year bonds.
Fahad Kamal, chief investment officer at Kleinwort Hambros, said “Earnings have been supportive of the narrative that growth isn’t falling off a cliff, it doesn’t necessarily look like a recession is coming. But companies have been cautious with their guidance.”
Now here’s the deal: There is zero doubt there is going to be an earnings shrink down in the next several quarters and the banks and financials are going to be at the top of the list. The question is, is that priced into the S&P?
Our Lean
I really think “less is more” right now. If you are one of the lucky ones and got long on Monday’s drop, you are in fine shape. If you’re like me and playing both sides, it’s just a matter of time until you get caught off base.
The high-frequency bots move the ES and NQ around with total ease. I always say you can beat the bots one time, two times, or even three times in a row but eventually, you will get spun around. I have gone back to trading the 90 minutes and the last 90 minutes. I find that looking at every tick isn’t conducive to trading; it makes you do stupid things and overtrade (one of the keys to avoid, especially in a bear market).
If I get a runner, that’s great. Otherwise buying the dips and selling the rips has been working, but with an upside bias. I know there is still a good chance the ES goes higher, but I still think you have to be on the lookout for some drops to (AKA some bear raids).
Sell the early rallies and buy the pullbacks. My gut says we run some sell stops today.
Daily Recap
The ES opened Wednesday’s regular session at 3938.50, traded down 3924.75 shortly after 10:00, then erupted ~50 points up 3974.50 at 11:00. After a 13.50 point pullback over the next 30 minutes, the ES climbed to new session highs at 3977.25 at noon.
Then in a bout of deja vu, GOOGL (like Apple on Monday) is reportedly freezing hiring for a couple of weeks.
The ES fell 38 points down to 3939 at 1:00, bounced 20 handles, then barely made new afternoon lows at 3938.50 at 1:45. The ES has one last bullish gust left in it, rallying back to 3972.50 at 3:33 — a lower high — then sold off down to 3962. The ES traded 3969.50 as the 3:50 cash imbalance showed $78 million to sell and dropped down to 3961 at 3:54. On the 4:00 cash close the ES traded 3962.50 and settled at 3953.75 on the 5:00 futures close.
In the end, “Our Lean” worked out as the ES went mostly sideways after the big up day. In terms of the ES’s overall tone, the NQ lent the ES a lot of support on the dips. In terms of the ES’s overall trade, volume was lower at 1.68 million contracts traded.
- Daily Range: 55 points
- H: 3977.25
- L: 3922.25
Technical Edge
- NYSE Breadth: 64% Upside Volume
- NASDAQ Breadth: 81.5% Upside Volume (!)
- VIX: ~$24
Game Plan: S&P 500, SPY, Nasdaq, Gold, TSLA
Many stocks have made great moves over the last three days. Now we need to see some of these names base a little bit and find support so we have something to measure against.
It’s looking like we may get some great individual stock trades to set up.
S&P 500 — ES

Doing a nice job pushing through resistance, the ES needs to hold the 3900 to 3920 area when it does eventually dip. Sub-3900 could accelerate the selling.
On the upside, let’s see how it handles 3987 — the 61.8% of the recent range. Above 4000 could eventually put 4100 in play, which was prior support in June and the major breakdown level last month.
A Trade on the S&P 500 Futures
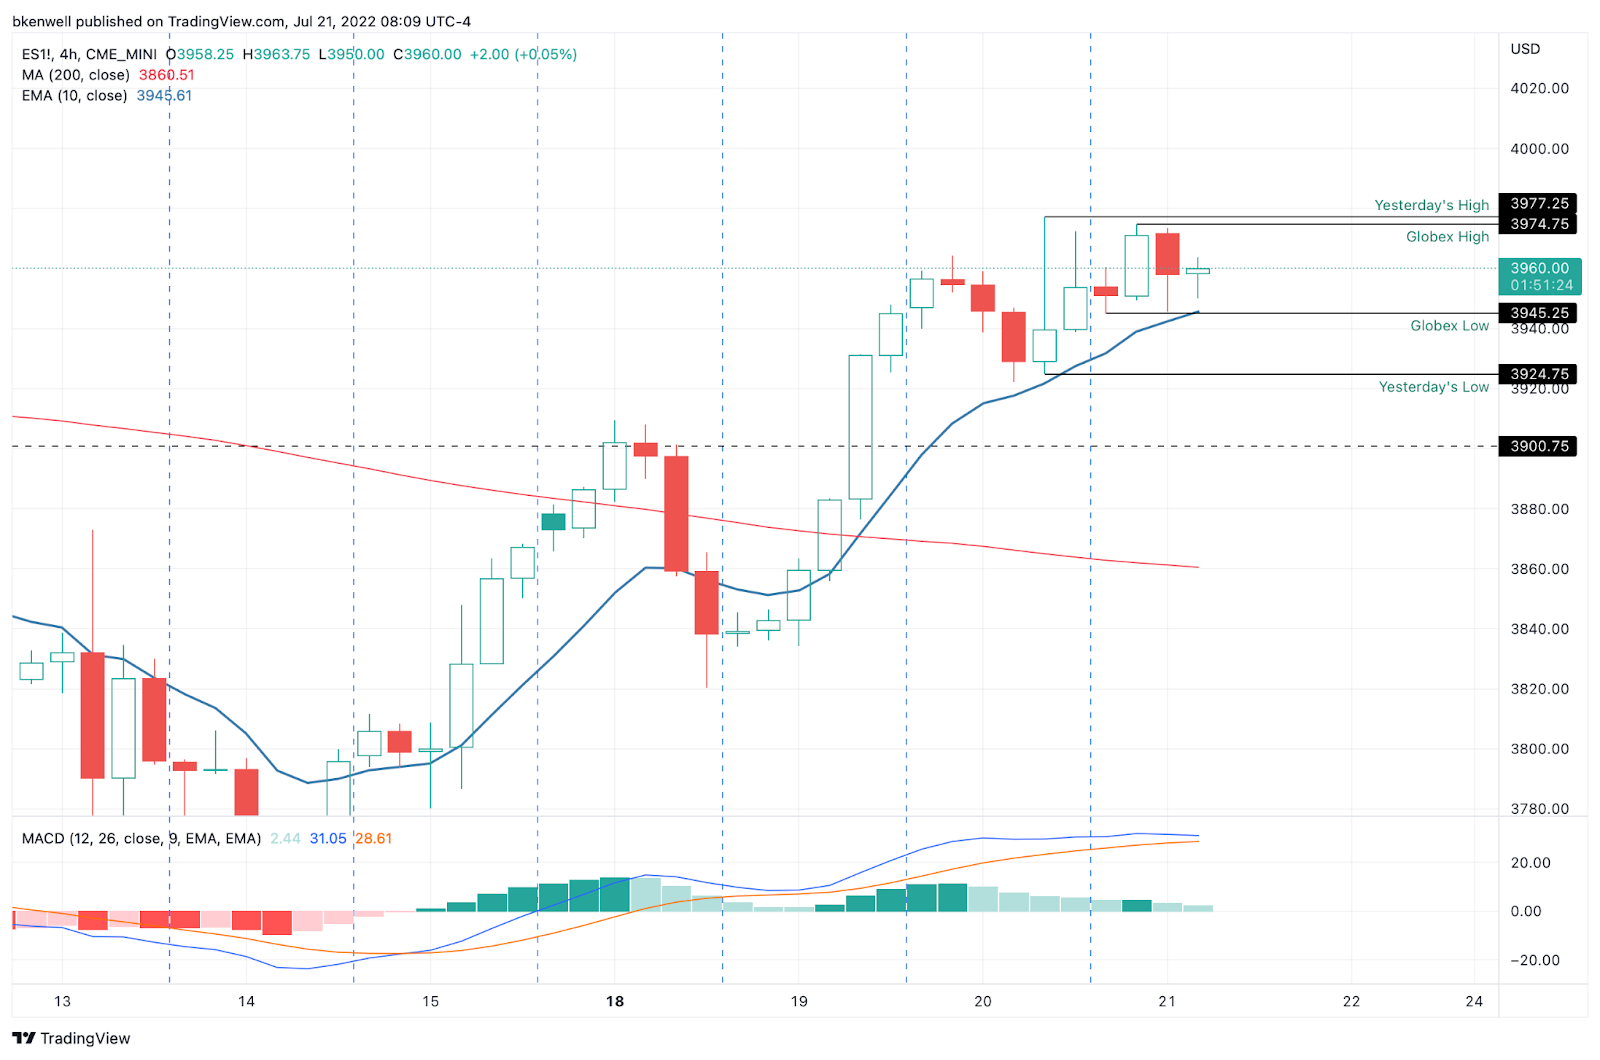
Zooming in on the four-hour chart, I’m watching 3945, which was notable support twice in the overnight session. It’s also where the 10-ema comes into play.
A dip to this area that holds as support is a buying opportunity. If it breaks and can’t be reclaimed, the 3920s could be in play, which as outlined above, is an area to keep an eye on.
S&P 500 — SPY

The SPY hit the 61.8% yesterday and is stalling a bit near the 10-week moving average.
If it can go daily-up over $396.25, then the $400 to $401.50 area could be in play.
If it goes daily-down below $391 (and thus drops below the 10-week and 50-day moving averages), the selling pressure could pick up a bit.
Nasdaq — NQ

There’s our 12,500s.
Above 12,550 could open the door to 12,800.
On the downside, I’d love a dip down to the 12,125 to 12,200 area that finds support. That’s prior resistance and the 10-day moving average.
Gold

Even amid weakness in the US dollar lately, gold can’t fetch a bid. It’s working on its sixth straight weekly decline.
However, it’s coming into prior support near $1670 and the 200-week moving average.
I would love to see an undercut of $1670, a tag of the 200-week and a reversal back up through ~$1672 to get long.
TSLA
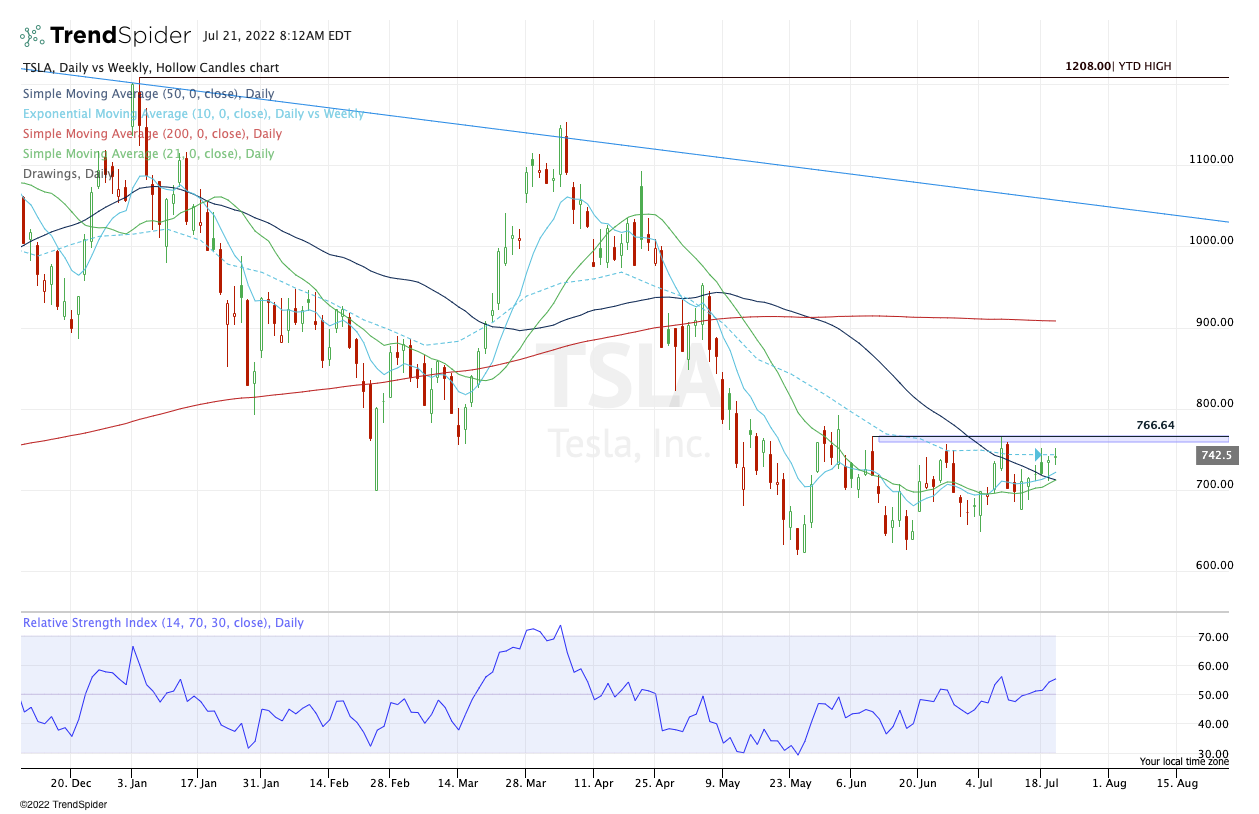
TSLA has a series of higher lows, but stiff resistance between $760 and $770. Gapping up to $760 in the pre-market on earnings, traders need to keep this zone in mind.
Above it is bullish and below it means this range is still resistance. Watch for an initial gap-up-and-fade — even just for some cash flow, like NFLX.
Go-To Watchlist — Individual Stocks
*Feel free to build your own trades off these relative strength leaders*
- Numbered are the ones I’m watching most closely.
- Bold are the trades with recent updates.
- Italics show means the trade is closed.
Trade Sheets: Down to 2 individual holdings against B/E or profitable stops. Good position to be in.
- MCK — We have hit two trim zones so far on MCK. Feel free to cash the last ⅓ of the position as you see fit. $335 to $340 is a potential upside target (and has since been hit).
- Moving stop-loss up to $315 and given the consolidation, I am thinking of holding my last ⅓ for a push to $348 to $350.
- DLTR — Down to ⅓ position and looking for $175 to $177 as our final target. Raising stops to the $165 to $166 area.
Relative strength leaders (List is cleaned up and shorter!) →
- DLTR
- COST
- PEP
- ABBV
- UNH
- XLE
- VRTX
- DG
- MCK
Economic Calendar

As we all know, there’s no crystal ball when it comes to trading stocks, options, or futures. But the Market Imbalance Meter may be as close as it comes. Knowing how the “Big Money” is placing its bets can give our trading room a big wave to ride — or a warning sign to stay out of the water. Come check it out now, risk-free for 30 days.
Comments are closed