We don’t love gap-ups in a down tape, but we have an open mind.
Follow @MrTopStep and @BretKenwell on Twitter and please share if you find our work valuable.
Don’t Forget: We recently noted the long-term performance of the S&P 500 (and what that means for investors and traders), and we also took a look at some longer-term setups for those interested.
Our View
Sometimes being right doesn’t mean it makes me happy. So far the ES is doing exactly what the seasonal and long-term statistics show and we are in the midst of the year’s weakest trading window.
According to Dow Jones Market Data, Monday was the S&P 500’s 48th decline of 1% or more this year. Yesterday the yield on the 10-year note rose to 3.878%, its highest level since 2010.
I am not going to talk about the British pound getting pounded or the Euro, or gold selling off or crude trading at its lowest level since January. And according to Zillow, home prices have fallen the most since August 2011 (a MoM decline of 0.3%).
The only thing I can say is everything feels so disconnected.
Our Lean — Danny’s Take
Is Turn Around Tuesday in the works? Well, it could be, and here are the reasons:
- The S&P has been down 5 of the last 6 weeks
- The S&P is becoming oversold
- The ES is holding the 3650 level
- The nearby stops are on the upside
If that doesn’t happen and the ES starts trading down through the 3650 level, I think it will be a quick trip down to 3620, then down to 3560 to 3570.
As for the end of the quarter stats, the end of September is prone to weakness from Q3 institutional portfolio restructuring. The last day of the quarter (Friday) has the S&P down 15 of the last 24 occasions and down 5 of the last 6.
Is a pump and dump coming or just the dump?
Daily Recap

After a bumpy Globex session, the ES opened Monday’s regular session at 3692, dipped 3.5 handles, the shot higher by 23 points in the opening minutes of trading. It climbed 42 points to 3730.50 at 10:25, which ended up being the session high for the day.
Ultimately, the S&P futures fell 73 points down to the session low of 3657.50 at 1:20, with plenty of 20 to 30 points rips and dips in between (as shown above). From there, the market turned, but the volatility remained as we had several 16 to 25-point rallies and fades, as we traded 3690 shortly after 3:00.
The ES pulled back to 3673.25 at 3:43, traded back up to 3688 at 3:46, and traded 3685.50 as the 3:50 cash imbalance showed $866 million to sell, and then ES shot up to 3697 at 3:54 and then sold off hard down to 3965 on the 4:00 cash close. After 4:00, the ES traded down to 3662 and settled at 3667.25, down 44.25 points or -1.2% on the day.
In the end, the ES made several attempts to rally but all failed and the late 35-point drop in the final minutes before the cash close was another great reminder of how not to fall in love with the rallies. In terms of the day’s overall tone, the ES was weak. In terms of the ES’s overall trade, volume was high at 2.83 million contracts traded.
- Daily Range: 73 points
- High: 3730.50
- Low: 3657.50
Technical Edge
- NYSE Breadth: 13% Upside Volume (!)
- NASDAQ Breadth: 28.5% Upside Volume
- VIX: ~$30.80
Game Plan: S&P, Nasdaq
We’ve had six 80%+ downside days in the last 10 trading sessions, with two of those sessions in excess of 90%+ downside days. That’s a lot of distribution and, quite frankly, something that doesn’t normally occur unless we’re near some type of low.
That doesn’t mean the low is in necessarily, but it has me on the hunt for some positives as we look to turn the page to Q4. We could still have some sort of capitulation move (which I would feel much better about if we saw it), so for now, the breadth numbers are just something to put in our back pocket.
Otherwise, the trends and price action are not very constructive.
Bonds are enjoying a meager rally in the pre-market after making new 52-week lows yesterday. The dollar index made new highs yesterday, which again, is a negative for equities.
Now coming into the day with the SPY up 1.4% and the ES up 50+ handles, the open will be interesting.
Long-time members know this, but for some of our recent additions, I must mention that I don’t like gap-up opens in a bear tape. It’s much harder to bottom that way. Further, with the VIX in the upper $20s and especially $30+, I shy away from almost all individual setups.
We were really patient through Q2 and layered on some down-right excellent traders in the summer. And now we’re back to waiting. I know it’s boring, but it is what it is — it’s better than being excited and losing money. We can go to the casino for that type of action.
There are four that do have my attention and it’s mentioned in the Go-To Watchlist area, with a link to the charts.
S&P 500 — ES
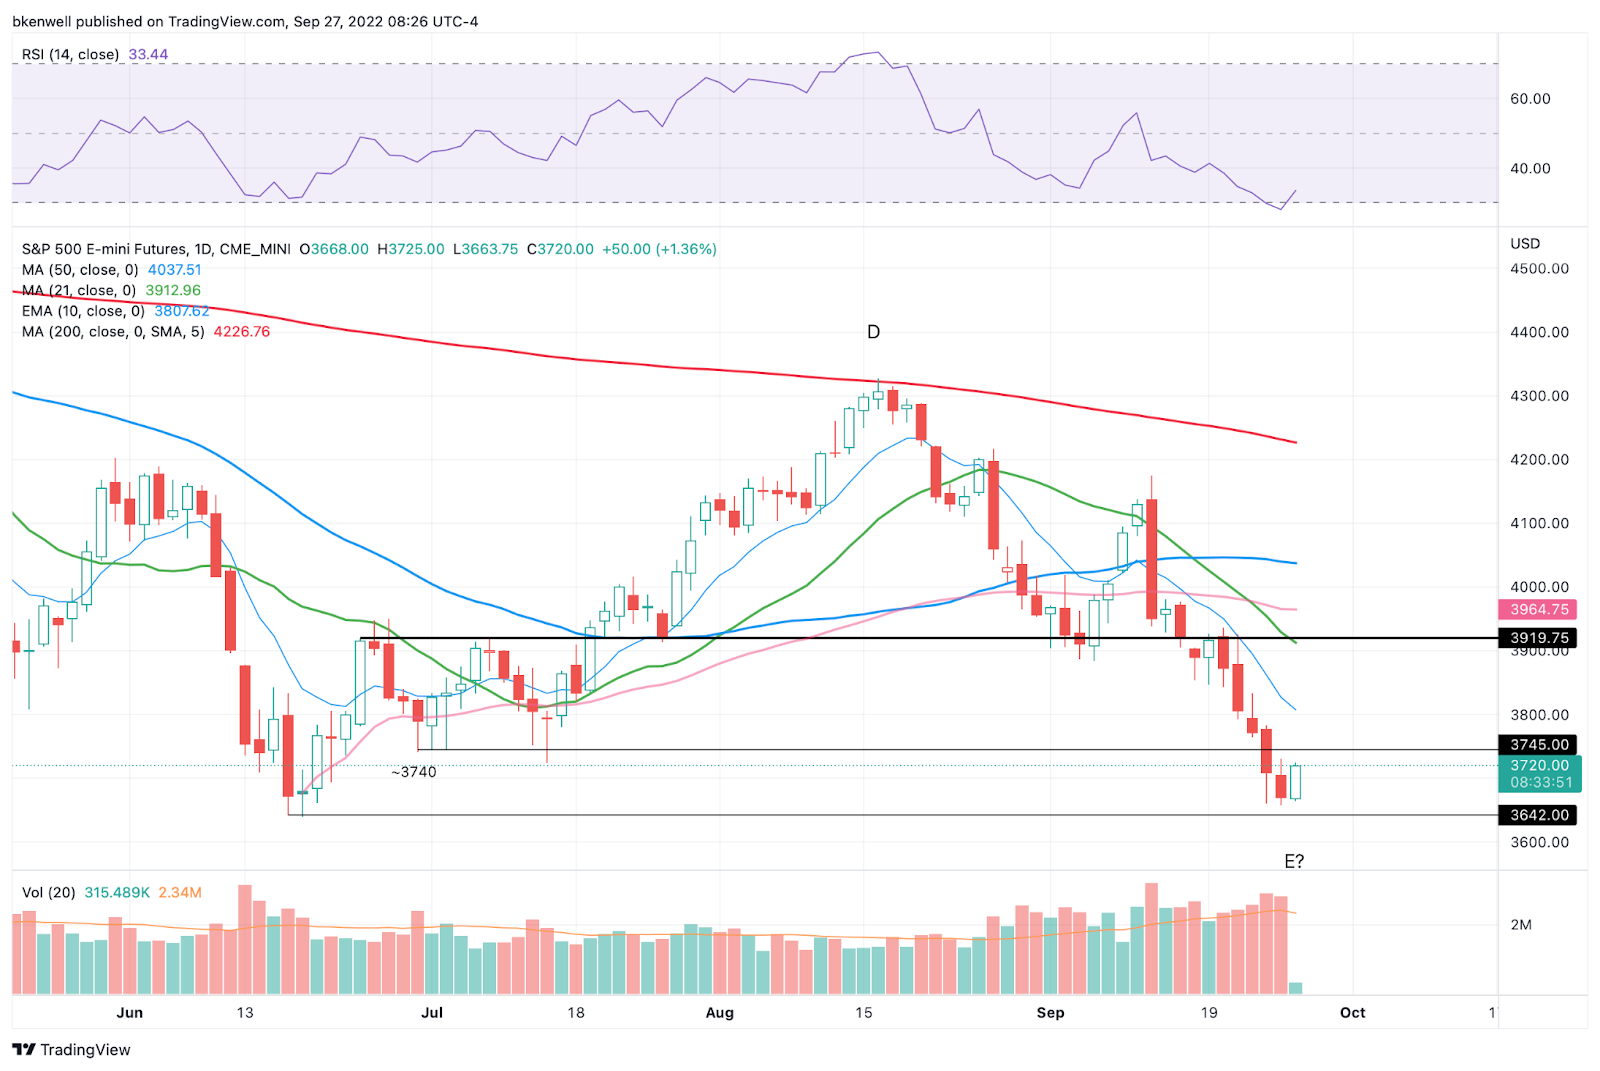
There was a great fade opportunity yesterday in the ES, and it was directly from yesterday’s 4H chart we posted for yesterday’s game plan. Friday’s cleaned up nicely too.
I hope these are helping traders navigate the current action.
The ES is trying to rally now, but coming into the session “hot” makes it hard to chase. Watch yesterday’s high near 3730. Above it and we get a daily-up rotation. Daily-up could give us ~3750, which was a key area a few months ago.
I don’t see the ES waltzing through the declining 10-day and/or 3800 level.
My concern is: Gapping-up in a bear tape and just to get to the daily-up spot, the ES has to climb 1.6%. That’s a big move.
About the worst thing bulls could see happen, would be a higher open like this, a tag of the highs, and a flush to take out the two-day low around 3660.
SPY

#KISS — We have a two-day range here with a ~$363 low and a $370.60 high.
A daily-up rotation that doesn’t reverse could eventually get us a gap-fill up to the $373.44 mark. This area is also in the prior support zone from July, so my gut says this area is resistance if we see it.
On the downside, if we give up all of our gains and test down into the $363 level, it’s hard not to look for a push down to the 2022 low less than $1 away at that point.
Nasdaq — NQ

The Nasdaq is actually a little more constructive.
We had that nice flush down to the 11,350 area — nice! — followed by an inside day yesterday. If we get the daily-up rotation today over xx, it could kickstart a move up to the 11,750 area (+/- 50 points) and the declining 10-day.
Like the ES, the risk is that the NQ needs to climb ~220 points or almost 2% just to get us the daily-up rotation and we’re set to open near this level. That’s not as desirable, but we’ll see how the day progresses.
A strong breadth day could be inspiring for more upside, especially if we go daily-up and hold that spot.
Go-To Watchlist — Individual Stocks
*Feel free to build your own trades off these relative strength leaders*
- Numbered are the ones I’m watching most closely.
- Bold are the trades with recent updates.
- Italics show means the trade is closed.
Notes:
- All done with the UUP/DXY dollar trade for now. Currencies are getting volatile and we want to book our gains and hold tight.
Relative strength leaders →
Top:
- ENPH — holding the breakout near $269
- LNG — nearing the breakout near $150
- MCK — holding the breakout near $340
- CAH — holding the breakout near $64 and the 50-day/10-week moving averages
Here’s a quick look at the stocks above (in the Opening Print Twitter Community).
- FSLR
- TAN
- ALB
- TSLA
- VRTX
- CYTK
- XLU
- XLE
- BMRN (weekly/monthly)
- PWR
- CHNG
- CELH
- UNH
Economic Calendar
More Fed speak today.

Comments are closed