A Note From Danny:
Some may ask why I write the ES recap and my answer is simple: Most of what I do is pattern recognition.
While I read charts, I do not use any indicators. What I do is all volume-based and writing the recap is my way of getting a feel for the overall price action. I am not saying that I do not pay attention to moving averages, but there’s a reason I covered my short before the ES rallied sharply.
I was looking for a stop run under 4608 and when it traded 4606 and some buy imbalances started showing up, I looked at how low the volume was at the lows of the day and I knew the shorts had piled in (not the longs getting out). I had said in Friday’s Opening Print to look for a late-day ‘pop’ and that’s exactly what we got.
Lastly, some folks on my Twitter feed were calling me a “guru” on Friday and while that’s very nice, I am anything but.
Once someone thinks like that, they are bound to be humbled — especially in this business. We all know the markets have a way of teaching lessons to even the smartest people and I’m not one of those people. I just do my work and try my best to follow it, which is not always easy to do.
As the PitBull taught me many years ago, “If you want to make the money you have to do the work.”
Let’s get to work.
Daily Recap
The ES sold off down to 4606.75 on Globex just before 9:00 am, rallied up to 4623 at 9:20 am, and opened Friday’s regular session at 4618.75.
From there, it shot up to 4638.50, pulled back about 10 points down to 4629 and rallied ~17 points up to 4645.75. That still wasn’t the opening high from the opening 30 minutes. The ES sold back down to the 4637 area and blasted up to the 4646 area and made its way up to 4752.50, up 34 points off the open and ~46 points off the Globex low.
The ES then dropped 16.5 points down to 4636 just after 10:00 and then rallied roughly 20 points up to the high of the day at 4655.75 at 10:21. It was a very active morning with plenty of back-and-forth action.
After the high, the ES got hit by several sell programs that initially took the futures down to the 4634 level, rallied back up to 4641, and then sold off down to 4614 at 11:25. After the low, the ES traded back up to 4641 at 11:46 and then dipped down to the 4625 on its way to the 4613 area going into 1:00.
From there, it short-covered up to the 4618 area and sold off down to the 4606 level at 1:25. After a ~10 point rally, the ES fell to a new daily low down at 4606, which broke the Globex low by a single point. Then it ripped back up to 4633.50 at 2:08, fell another 10 points, then shot up 20 handles to 4641 at 3:04.
As the early MIM started to show $300 million to buy shortly after 3 p.m., the ES dipped 10 points down to 4631 before several buy imbalances hit the NQ and ES at 3:25 p.m., pushing the latter up about 4650.
After a small pullback down to 4643.50, the ES back-and-filled between 4645.50 to 4656 just before the 3:50 cash imbalance. The ES traded 4650.50 as the final MIM showed $2.197 billion to buy and traded up to 4658.50.
On the 4:00 cash close, the ES traded 4653.75, but climbed to and settled at 4664 on the 5:00 futures close, up 12 points or +0.26% on the day and up 58 points off the 4606 low.
In the End
In the end, it was a very rough trade with some big rips and dips. In terms of the ES’s overall tone, it was weak until just after 2:00 and then powered higher late in the day. In terms of the day’s overall trade, volume was steady at 1.85 million contracts traded.
I have a question for you:
If jobs growth is down three months in a row, prices of everything are up 7% and total sales dropped by more than 1%, then “real” sales dropped by more than 8%!
Is this not an implosion?
My question is, will the Fed still raise rates with sluggish job growth and sales dropping so dramatically?
(one-second poll, here)
Is it time to buy stocks as rates will stay low for 2022?
Our View — Bond Debacle
First and foremost, I want to say that it doesn’t matter what factors play into a correct call, but the PitBull’s Thursday/Friday low the week before the expiration worked like a charm.
The million dollar question is, will the ES hold the rally during the January expiration week?
There are a host of reasons why sentiment is turning sour:
- Weak retail sales and manufacturing data, inflation data, and lackluster bank earnings on Friday sent the markets lower until Friday’s late buying spree pushed the ES and NQ into positive territory.
- The Dow and S&P both fell for the second week in a row and the Nasdaq saw its third weekly lower close as the yield on the U.S. 10-year note rose for its fourth straight week and notched its largest rise since March 2021.
- Friday’s late rally was not enough to erase the weekly losses and both the S&P closed down 0.30% for the week and the Dow shed 0.90%.
One of the things your chart doesn’t show is how money flows in and out of the market.
In my opinion, the reason the ES and NQ rallied so much late Friday was the guys with the better seats had over $2 billion to buy on the close. I do not pretend to know how the entire process works, but I think the algos can detect a shift in the stock order flow as the MOC buys orders are entered.
The cash buying widens out the premium between the S&P cash and the S&P futures and causes index buy programs. You literally could see that during Friday’s late-day rally.
Our Lean
Broadly speaking after Friday’s action, my guess is we see some type of pullback, then rally again. Do I think the low is in? I’m not sure about that, but if you take the price action in the last two weeks, it’s been all about the failed rallies.
This week is the January options expiration. See the Ned Davis cash study for the S&P and Nasdaq for this week’s stats.
If the ES gaps higher, my lean would be to sell the early rallies and buy any 30 to 40-point pullback. On Friday I pointed out that the ES had a big line of sell stops from 4608 down to 4585. I can’t rule out some type of retest. I also can’t rule out eventually seeing some type of retest of the December low at 4495.
As you know, I write the OP the day before and rarely modify it. This morning though, I am adding this:
While the markets look weak right now, there was a story last week that Goldman Sachs’ elite were going to get paid special bonuses and those at JPMorgan were going to rise as much as 20%. The payment of year-end bonuses is in January and many times, the bonus money is used to purchase stocks, driving up prices.
Remember the old saying, how January goes, so goes the year. We may see some type of bounce this morning. Watch yesterday’s low and last week’s low, but don’t be in a rush to force something.
We have had a tremendous start to the year while the market has not and we don’t need to trade everyday. We worked hard for our profits and the last thing we want to do is give them away. Stay safe & stay smart.
As we all know, there’s no crystal ball when it comes to trading stocks, options, or futures. But the Market Imbalance Meter may be as close as it comes. Knowing how the “Big Money” is placing its bets can give our trading room a big wave to ride — or a warning sign to stay out of the water. Come check it out now, risk-free for 30 days.
Technical Breakdown
- NYSE Breadth: 52.3% Upside Volume
- NASDAQ Breadth: 57.2% Upside Volume
The market flushed lower on Friday before finding its footing late in the day and closing near flat on the session.
In that case, it’s no surprise we were left with a mixed 50/50 breadth reading on both the NYSE and NASDAQ.
However, this type of action is about what we had for the whole week, which makes this week even more important.
Game Plan
I want to preach patience — especially on a dicey Tuesday morning — and let the market show its hand before piling in and forcing a bunch of trades early this week.
Remember, it’s the start of earnings season, Opex week and the market just gave us a doji week (AKA an indecisive week). We want to keep the key rotation points in mind (last week’s high and low) and stay ready to pounce, yet ready to take our finger off the trigger in case the optimal setups don’t come our way.
S&P

A doji-ish finish to last week in the S&P cash and it’s third test of the 21-week moving average in seven weeks. You know what they say: the more times a level is tested, the more likely it is to fail.
Are we there now?
It’s something to keep an eye on. Again, I don’t think it would be out-of-this-world crazy to retest 4300 to 4350 area and the 50-week moving average. Currently that would represent a dip of ~9% to 11% off the high.
That’s eventually. For now, the trend remains higher, but keep in mind there are headwinds to fight through and clearly the strength in the S&P is waning.
Right now, the level to watch is 4582, which is last week’s low. It’s also where the 21-week and uptrend support (blue line) come into play. Below that and 4495 is noteworthy, which is the December low.
I mostly want to see how the S&P handles today’s gap down. Do they bid it up and erase today’s losses or does it act as the “first domino” and we get lower action this week?
That will determine whether we are selling rips or buying dips.
Nasdaq

The Nasdaq looks a little more precarious, as you can see with the NQ futures above. A clean doji week is being met with selling this morning.
The NQ finished above that 15,500 support area. Further, it was the NQ’s second consecutive weekly close below the 21-week moving average.
With this week’s move lower, it’s clear that last week’s low at 15,152 may be in play. Below that and 15,000 is on the table.
Like the S&P, I want to keep in mind that the overall trend remains higher for now, but I don’t want to ignore the possible downside levels.
On the upside, 15,500 is the first area of interest (prior support), followed by this week’s current high at 15,653. Above that and bulls can focus on the 10-day and 21-day moving averages and the 15,700 level.
10-Year Yield
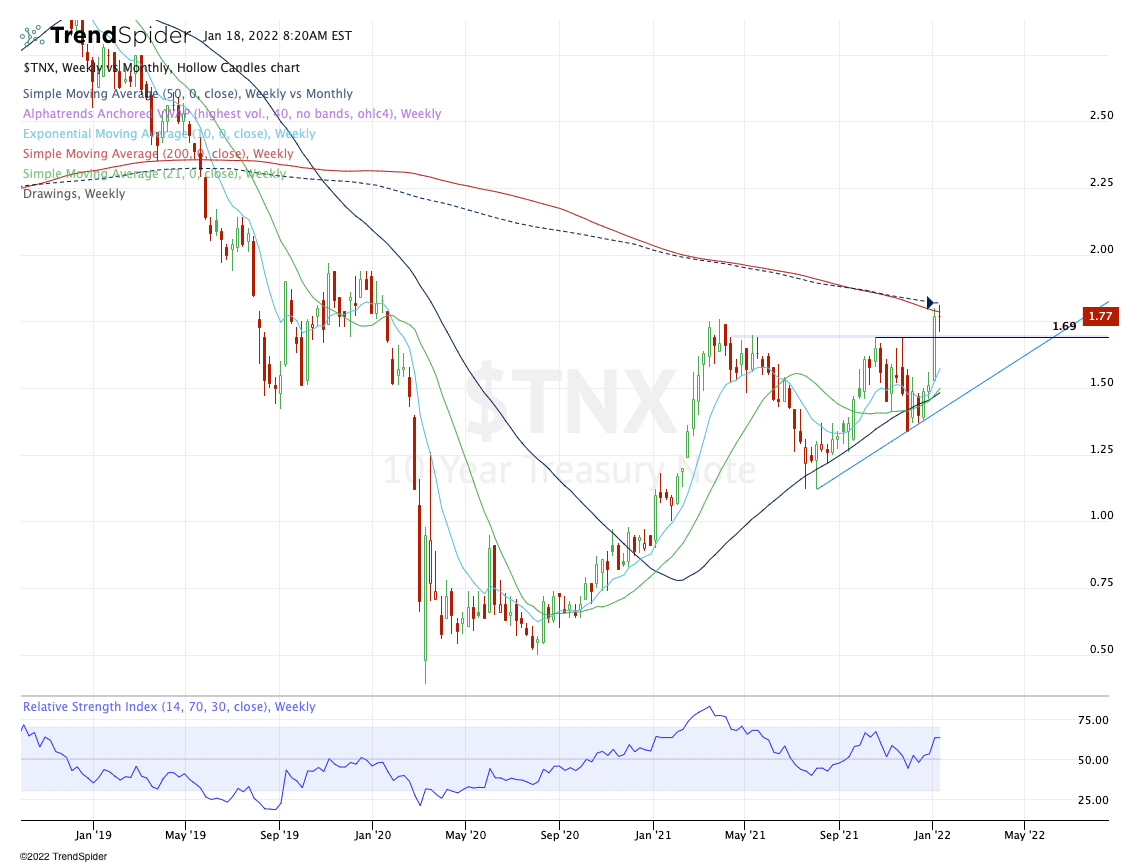
Everyone’s latest infatuation is with the 10-year yield (TNX). It had a powerful breakout last week over 1.69 and is running right into the declining 200-week and 50-month moving averages.
If it continues higher, tech stocks will likely continue lower. Back below 1.69 and we can see some reprieve in tech.
Individual Stocks — ARKK, GS, Go-To List
I want to see how the indices are going to shake out today. Set to gap down about 1% in the S&P, it creates both opportunity and risk. That has me looking at the Go-To Watchlist.
Additionally, remember that energy and financials have been our sector leaders lately. With earnings underway now, we’re at risk of losing the financials — which would take one more pillar of strength away from the broader market. Keep that in the back of your mind if they are selling banks this week on earnings.
Go-To Watchlist
- Energy (PXD, FANG, DVN, SLB, COP, CNQ and XOM)
- Financials (KRE, ASB, TD, STL, MET) / Regionals holding up better than investment banks
- F
- ABBV (watching weekly more than daily)
- QCOM — great weekly chart.
- CAT
- DE
- BRK.B
- KO
- PG (weekly setup from Friday is in play)
- AMAT (may need a few days to set up)
ARKK

I don’t know when ARKK will bottom, but we have done pretty well trading this one both long and short.
Set to gap down on Tuesday morning, keep an eye on last week’s low near $77.50. I’m of course looking for a potential reversal through this level should it break below it this week.
However, my bigger interest is just below that area, where we have the 161.8% downside extension, followed by the 50-month and 200-week moving averages.
Keep ARKK on your radar this week.
Goldman Sachs — Earnings

GS missed on earnings this morning and is gapping down as a result, currently near $365 in the pre-market.
That’s about $1 to $2 below the December low and near the 10-month moving average. An open near this level and a rally back up through $366.65 (last month’s low) could give us a quick bullish reversal setup with a decent R/R.
If we get the setup with a risk of ~$1, we could easily be in 3:1 territory as far as our R/R goes, allowing us to trim and move to a B/E stop.
Again, don’t force the trade if it’s not there, but GS is one I’ll be watching today.
Economic Outlook
As we all know, there’s no crystal ball when it comes to trading stocks, options, or futures. But the Market Imbalance Meter may be as close as it comes. Knowing how the “Big Money” is placing its bets can give our trading room a big wave to ride — or a warning sign to stay out of the water. Come check it out now, risk-free for 30 days.
Disclaimer: Charts and analyses are for discussion and education purposes only. I am not a financial advisor, do not give financial advice and am not recommending the buying or selling of any security.
Remember: Not all setups will trigger. Not all setups will be profitable. Not all setups should be taken. These are simply the setups that I have put together for years on my own and what I watch as part of my own “game plan” coming into each day. Good luck!
=
Comments are closed