After big moves like this, I like to put up some of the stats.
- The Dow Jones closed down 1164.52 points, or 3.6%, to 31490.07, its lowest closing level since March 2021
- Both the S&P and Nasdaq suffered their worst day since 2020
- Target shares declined 25% after the company posted quarterly earnings that missed Wall Streets’ expectations and had its worst one-day performance since Black Monday in 1987.
- Costco, Dollar Tree, and Dollar General recorded their largest single-day percentage declines in years — in Costco’s case, since 2003.
- Consumer discretionary and consumer staples were the worst-performing sectors in the S&P 500 Wednesday. Both recorded their largest single-day percentage losses since March 2020.
- Gas prices hit a record average high nationwide, above $4 in all 50 states for the first time.
- Cisco, the biggest maker of computer-networking equipment, said it expects revenue to decline in the current quarter, hurt by disruptions stemming from Chinese lockdowns and the Ukraine war. The stock dropped as much as 19% in post-market trading, the steepest in its history.
Our View
While the 2008 credit crisis was not that long ago, there are a lot of readers that were not trading back then. For the traders that were around, they know how every time the markets fell, the Fed and the PPT — the Plunge Protection Team — were right there supporting the markets with its QE programs.
During the credit crisis, the Fed’s balance sheet grew to $2.2 trillion. At the time, it was an unheard-of number. But the S&P cash rallied from the 666 low in March 2009 all the way up to 3393 before the Covid-19 pandemic broke out. That’s a gain of more than 400% in 11 years.
Some will argue it was a Fed-bought rally, and to some extent it was, but it was also very effective.
Along comes Covid-19 and in two years the Fed racks up an unsustainable $9 trillion in debt in the midst of a worldwide slowdown, with Russia invading Ukraine and destabilizing the entire world.
I know there are a lot of nervous people out there and in most cases, I would be looking for the silver lining, but I just don’t see it. The Fed is behind the 8-ball and inflation is raging alongside raising rates. As the Fed cuts its money printing in June, there is going to be a big hiccup! It’s all a recipe for disaster.
Our Lean
The ES is under extreme selling pressure and is accelerating to the downside. The contract high in the ES future is 3933.25 and this morning’s low is 3856 — a point above the 2022 low. As I type, it’s currently down 19.4% from the all-time high and shows no sign that it’s going to recover anytime soon.
I think the ES is going a lot lower than 3800. As always, I can’t rule out a bounce, but I think you just keep selling the rallies. ES 3500 is the level we are looking at.
Daily Recap
The ES opened yesterday’s regular session at 4038, and made an early high at 4041.50 the ES CRASHED. At 1:20 ET the ES traded 3942.25, down 147.5 points or -3.50%. This is in sharp contrast to Tuesday’s rally and last Friday’s reversal and another great example of what I call a bear market ‘false start.’
I could do all the 10 and 30-point pop’s but why? The ES, NQ, and YM got murdered. The sharp reversal should be a constant reminder of how the S&P price action has gone from making a new high, pulling back, back and fill and rally again, to drop hard, rally, and drop harder.
The ES traded 3924 on the 4:00 cash close and after 4:00, the ES tumbled down to a new low at 3905 and settled at 3914, down 1.76 points or 4.31%.
In the end, it was another very bad day on an extended list of many. In terms of the ES’s overall tone, there was massive liquidation, but mostly in stocks. In terms of the ES’s overall trade, volume was not overly large considering the size of the decline, with 2.1 million contracts traded.
- Daily Range: 189.5 points
- H: 4095
- L: 3905.50
Technical Edge
- NYSE Breadth: 93% Downside Volume (!!)
- NASDAQ Breadth: 80% Downside Volume
- VIX: ~$32
The tough tape continues as the VIX rips and equities plunge. The S&P futures missed the 2022 low (3855) by a point in the Globex session.
That is the line in the sand today.
The S&P 500 achieved its pattern of retesting the 50% retracement. Now it’s back on the decline. There are some positives showing up, but not enough to feel all that great. This is a “stay on your toes” market right now.
Game Plan — S&P (ES and SPY), Nasdaq (NQ and QQQ), Individual Stocks
S&P 500 — ES
**On the video, coming soon!**
On the downside, 3855 is the line in the sand. Outside of breaking this mark and reversing, be careful with the ES below this mark.
On the upside, yesterday’s low at 3905 is key. Above that opens the door to the Globex high at 3933. Followed by 3975 — the 50% retrace from Wednesday’s high to the Globex low.
SPY
**On the video, coming soon!**
Very similar to the ES. Watch $385.15 on the downside. That level will be key and is a line in the sand.
On the upside, $390.55 is yesterday’s low and will be the gap-fill mark once we open. Above that and we can potentially squeeze higher. Below it and the SPY remains vulnerable.
Nasdaq — NQ
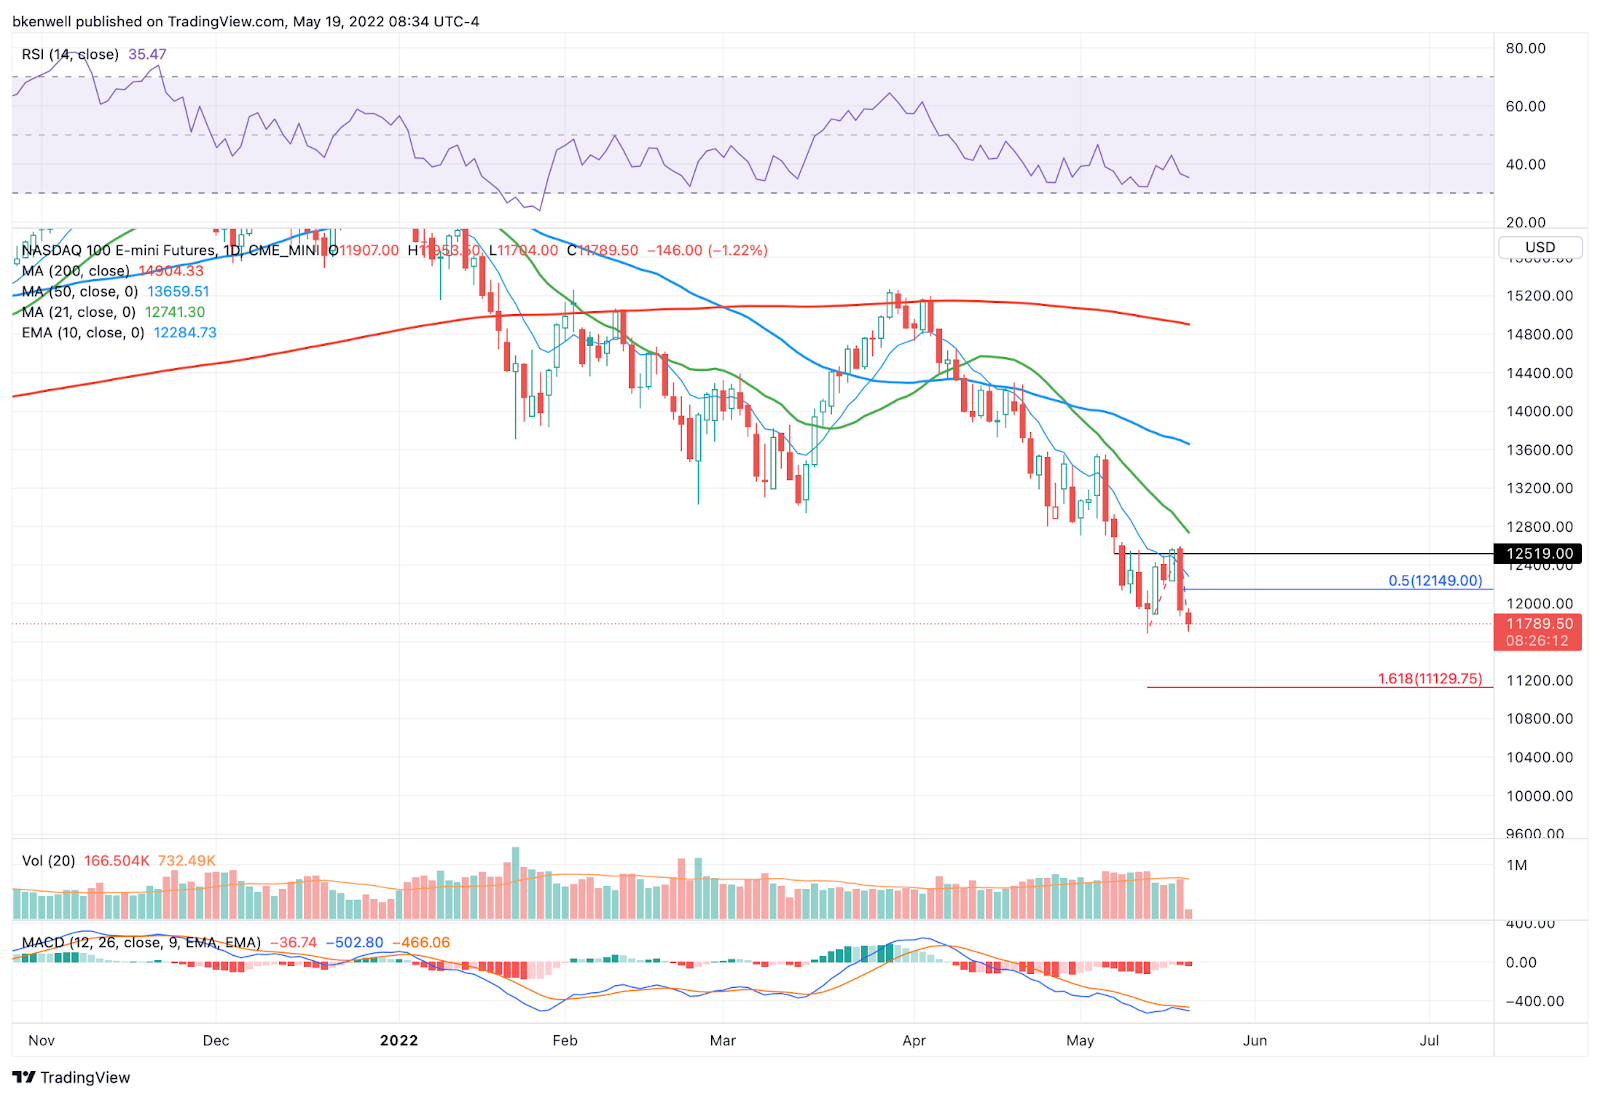
A downside leader yesterday, the NQ is barely holding above its low at 11,689. Short of a break of this level and a reversal, this is a key line in the sand. Below it and traders need to be cautious on the long side.
It could open the door to the downside extension near 11,150.
On the upside, watch Wednesday’s low at 11,863. Above that puts the Globex high in play at 11,953.50. Above 12,000 and it’s possible we rally to 12,150, but just go level to level.
Nasdaq — QQQ

$284.94 is the line in the sand on the downside.
On the upside, the gap-fill level is at $289.85. Above $290 and perhaps we can test the 10-ema on the hourly chart. As of yesterday close, that’s at $295, but it will be lower once the action gets underway.
Bonds — ZB

Bonds were one of the few things that traded well yesterday and now ZB is looking for a weekly-up rotation. Over 141.03 and it’s possible that ZB squeezes up to the 143 to 144 area.
There it would find the declining 10-week and 50-day moving averages, as well as a key support/resistance area from earlier in the year.
Below 141.03 and I don’t want to see it lose today’s low, as it would put ZB below the 10-day and 21-day moving averages and put 138 back in play.
Oil — XLE

While energy sold off yesterday too, it’s been the one consistent area of relative strength so far this year.
Yesterday we all but tagged the 10-day. It hasn’t spent much time away from this measure. That said, the pre-market action has my attention.
That’s as it trades below yesterday’s low of $80.73 and is into the exhaustive-high we saw in March at $80.22. I want to see if the XLE can open below yesterday’s low and reclaim it, giving us a potential low-risk long. That’s especially if it can stay above $80.
I don’t love trading many individual stocks in a high-VIX tape. aHowever, energy has had relative strength and the XLE is a sector ETF with solid liquidity.
PXD
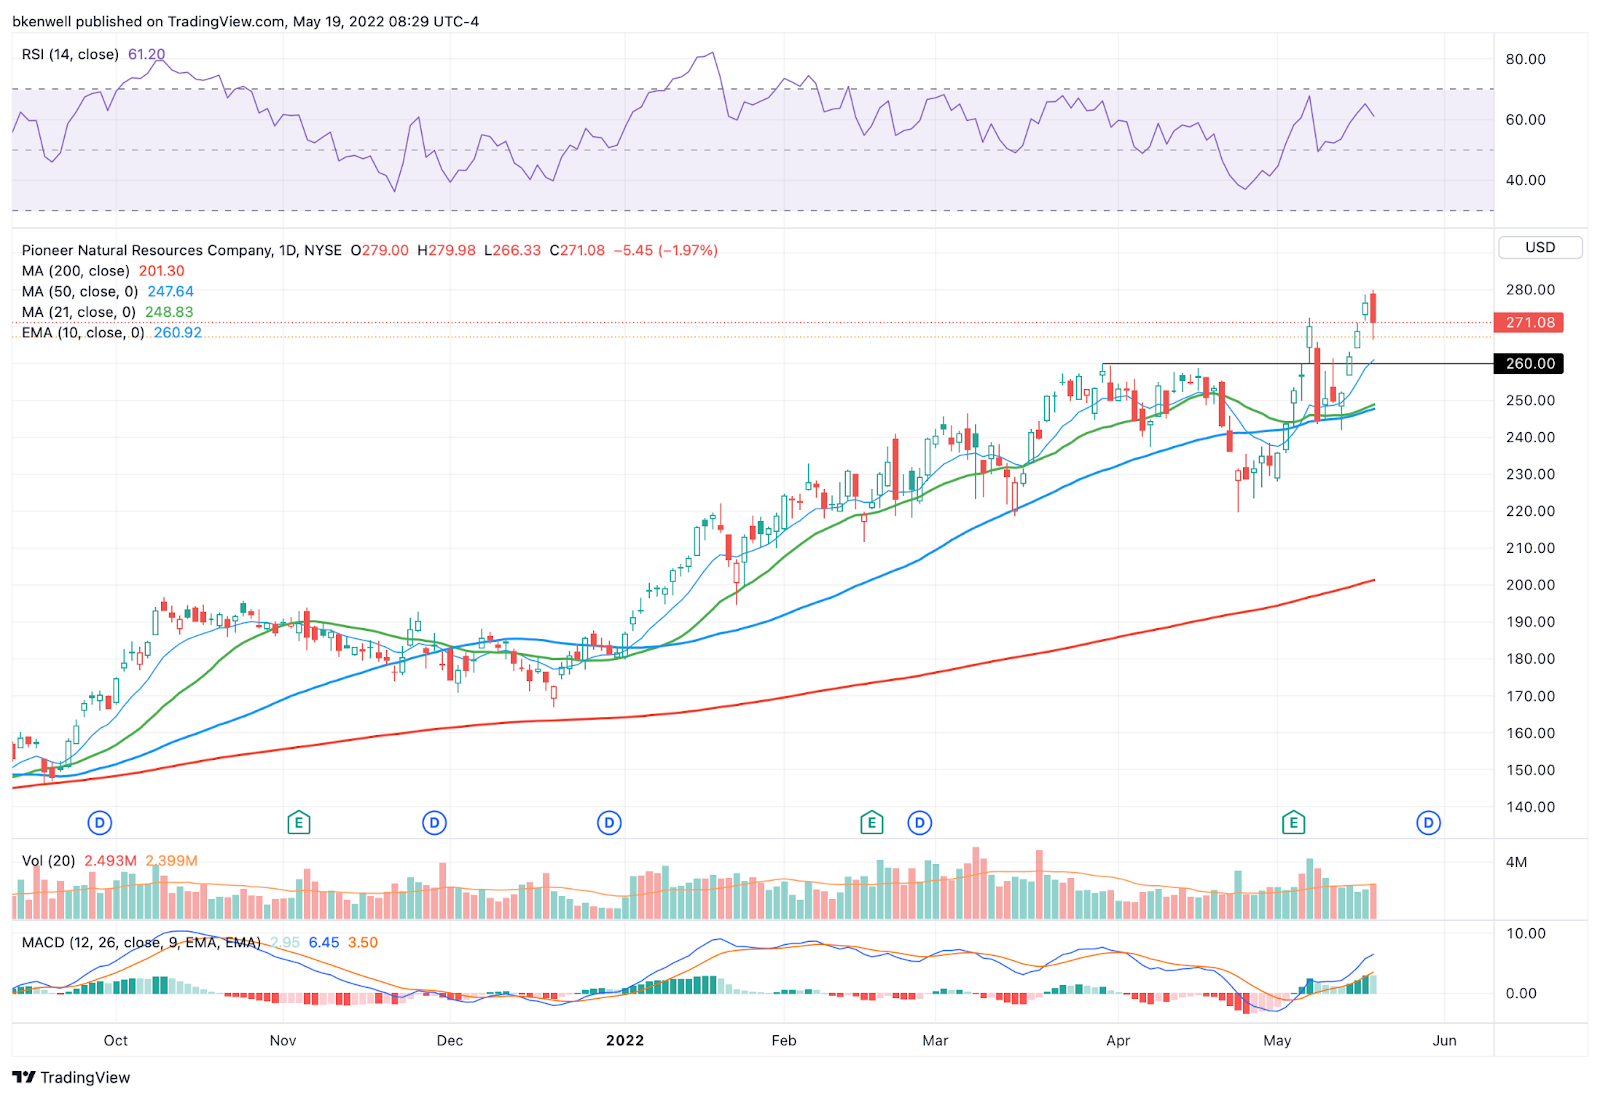
Far less liquid than the XLE, I do want to see how PXD handles the $260 level — if not just to use it as a barometer for energy stocks.
Go-To Watchlist
*Feel free to build your own trades off these relative strength leaders*
Numbered are the ones I’m watching most closely. Bold are the trades with recent updates.
- AR — Target No. 2 at $36 was hit. → Ideal final target is $38.50 to $39. However, if we lose Wednesday’s low of $34, manage according to your risk tolerance (B/E stop is down near $31, but that’s a lot of profit to cough up).
- ABBV — Weekly up → $148.75 seems like a reasonable stop-loss level. $150 for more conservative traders. On the upside, I’d love $160 to $162 as our first trim. More conservative traders can trim at $157. Conservative trim hit.
- XOM — this target hit “Above $92+ and feel free to trim as much as you want.”→ B/E stop on the remainder of the position ($89). $96 to $97 is a big extension area if it can really get going.
Relative strength leaders (List is cleaned up and shorter!) →
- XLE — A nice run here. Let’s start looking at pullbacks to buy.
- AR
- PEP
- KO
- MCK
- MRK
- BMY
- JNJ
- DOW
Economic Calendar

As we all know, there’s no crystal ball when it comes to trading stocks, options, or futures. But the Market Imbalance Meter may be as close as it comes. Knowing how the “Big Money” is placing its bets can give our trading room a big wave to ride — or a warning sign to stay out of the water. Come check it out now, risk-free for 30 days.
Comments are closed