Our View
The PitBull has been negative since the middle of November and told me he thinks the markets are going to get killed — and fast. He also said he thinks people are offside going into the January expiration. “You know how I do my charts every night and how many of the hot stocks are down over 50% or 60%.”
He also reminded me of the chart he sent me on the Fed’s balance sheet. He said that it was unsustainable and he also mentioned that he wouldn’t be surprised at a 0.50% rate hike from the Fed next week, as they are behind the eight ball.

I had another rough morning even though I sold the ES near 4588 and the NQ near the highs. I got flat after getting in and out a few times and losing, then the markets got slammed. I thought you could sell the 40-point rallies but I didn’t see a 70-handle rally coming and flattened out before the markets sold off.
I did sell 6 ES at ~4571 and covered 3 when the ES was down 20 points and the other 3 lots down 30 points, but the ES went crashing lower. I needed a runner.
Going into 3:30 the MIM was showing $800 million to buy, but I heard that the buy orders were paring off and the 3:50 imbalance was going to be for sale. You may remember earlier this week that I said the sell stops in the ES were under 4508 and all the way down to 4485.
After the MIM showed over $1.3 billion to sell, things just fell apart and got worse after Netflix came crashing down after reporting.
It just became a perfect storm to the downside. We all know trading the ES and NQ futures is the hardest game in town and I’m really leaning toward trying to trade options, but that’s really not my forte.
Our Lean
It’s not hard to see that the markets are in trouble. We all knew that 4 to 6 big stocks were making up 20 to 30% of the S&P and Nasdaq’s gains and that everyone was long those big names.
I have repeatedly talked about how much the S&P was up since the 2009 credit crisis and since the March 2020 Covid-19 lows. I have also talked about how the Fed racked up a record $800 billion in debt during the credit crisis and how it ran up over $9 trillion in debt since Covid.
Many people just shrugged this off and said they can just print more money, but it really is unsustainable and the threat of higher interest rates will make it impossible to pay down and the markets are adjusting to this new reality.
Our view is to not forget that the markets are in a downtrend and that every rally — no matter if it is 30 points or 100 points — has failed this year. That said, here’s how the last ten “corrections” have panned out for the Nasdaq.

As for Friday, I think we see an early rally because the S&P cash closed at 4482.73 and on the 5:00 futures close the ES went out at 4456.25 — a discount of 26.48 points and fair value is around 8.45 points (source).
When things get that cheap vs. the S&P cash, it usually causes an initial rally.
The ES 200-day moving average comes into play around 4416.50, so that will be the next key level. The 50% retracement from yesterday’s range is ~4517. I’m not saying we’re going there, but I expect another big day of rips and dips.
Lastly, there were upside margin calls and downside margin calls and there will be more today.
Daily Recap
We had a gap-and-go right off the bat, with the S&P and Nasdaq flying higher on Thursday morning. Let’s not get into all the morning action, because it was pretty damn simple: We gapped higher and climbed into the afternoon where breadth was strong throughout the session.
However, momentum was waning shortly after noon — although not quite bearish — until the real selling started to show up. As tensions rose over the situation in Ukraine, the ES and NQ suffered a quick move lower and never recovered.
At 2:00 p.m. the ES was 34.50 handles off the high, traded up to the 4573 level — last week’s low — and was rejected. Then a wave of sell programs knocked the ES down to ~4524 at 3:10. After a small bounce, the ES sold off down through the sell stops to 4495 at 3:39, bounced 10 points, and then sold off to a new low at ~4484 at 3:49.
The ES traded 4487 as the 3:50 cash imbalance showed $1.3 billion to sell and then sold off down to 4469 at 3:58, down 55 points on the day and down 125 points from the high. The ES traded 4474 on the 4:00 cash close and then plunged down to 4437.75 at 4:44 before bouncing back up to 4456.25 on the 5:00 p.m. futures close, down 68 points or 1.5% on the day.
In the End
There was a big rally and then a crash, with the Nasdaq falling 3% from peak to trough and closing down ~2% on the day. It’s now down 12% from its high. The S&P fell 1.5% and has closed lower in 9 out of the last 11 sessions and is down 6% this year, while the Dow fell for its fifth consecutive session, its longest losing streak since September.
In terms of the ES’s overall tone, it was horrible and only got worse after Netflix fell $100 a share after reporting earnings. In terms of the day’s overall trade, 1.986 million futures traded.
As we all know, there’s no crystal ball when it comes to trading stocks, options, or futures. But the Market Imbalance Meter may be as close as it comes. Knowing how the “Big Money” is placing its bets can give our trading room a big wave to ride — or a warning sign to stay out of the water. Come check it out now, risk-free for 30 days.
Technical Breakdown
- NYSE Breadth: 76.5% Downside Volume
- NASDAQ Breadth: 65.7% Downside Volume
What a rough session Thursday turned out to be. There were some solid opportunities in AAPL, AMD, and TSLA in the morning, but the S&P trade was difficult.
I had a hard time being bullish yesterday because of the gap-up action. That said, it was easier to sell the rally on Tuesday vs. Wednesday. I don’t know why, but that’s what my gut told me:
“I felt more confident about fading yesterday’s [Wednesday’s] open than I do today.”
That said, the S&P definitely went higher than I thought it would yesterday and the breadth was running quite strong — about 85% upside — before the afternoon spill. But did anyone notice that ARKK closed green?
That was an interesting development to me. Maybe it’s just a one-off event, but it’s something to keep note of. That said, it’s not great to see that sentiment is still so complacent.

It is really something to consider when many of the long-time pros out there tell you this is one of the more difficult markets they have traded. If you haven’t gotten your ass handed to you, consider it a win. If you’re flat or up through this mess, give yourself two pats on the back. It hasn’t been easy.
Game Plan
Today’s Game Plan is simple: Don’t be a hero!
If a setup presents itself, then by all means pull the trigger. But there’s nothing wrong with reducing your position size in this type of mess or completely sitting it out.
Buying dips, selling rips — all of it is going to be hard if you don’t have the discipline to get out quick when you’re wrong. If you can’t do that (and there’s no shame in it) then know your weaknesses and protect your capital. It’s as simple as that.
S&P

I have been pretty steadfast in arguing that the longer-term trend has been higher, but that caution flags have been piling up.
Even though we weren’t getting outright short the S&P two weeks ago, I consider it fortunate to know we’ve been sidestepping a ton of land minds and catching some decent moves in the short term.
Gapping lower so far this morning, the SPY is below yesterday’s low. The ES, not quite.
If we get an open below $444.50 and a reclaim of this mark, it could set us up for a possible bounce (on expiration Friday).
With the S&P so close to the 200-day, it’s hard not to think this moving average could act as a magnet. That’s a little over 1% from yesterday’s close.
A higher open is likely the worst-case scenario for bulls.
Nasdaq is in Correction Territory

Yesterday afternoon I was looking at the QQQ before it got body-slammed. After losing the 200-day, that leaves the 50-week and weekly VWAP measure in play near $358-and-change, as well as the gap-fill near $360.70.
The $358.50 area could act as a bounce level or at least give the bulls a chance to play a rebound. So far, that’s where the QQQ is trading now in the pre-market.
I don’t want to come out here and say, “Buy the Q’s at q$358-half!” and then watch it roll over to $350 and see a bunch of people get hurt. Instead what I’m saying is, use these levels as a way to navigate and have a rough idea of where the key support and resistance areas may be.
Yesterday we were bearish on the QQQ & NQ if it couldn’t hold last week’s low (which it didn’t). Now we’re looking at potential bounce zones. If they fail, so be it, and we’ll look for lower levels.
Individual Stocks
Again, today’s game plan is simple: Don’t be a hero. Let’s look at some individual names going into the last trading day this week:
Go-To Watchlist
- Energy (PXD, DVN, SLB, COP, CNQ and XOM)
- TD
- MET (needs to hold last week’s low though at $66.67)
- ABBV (watching weekly more than daily, looking for ~$129/10-week ema)
- QCOM — nice weekly chart but needs $168+
- CAT
- DE
- BRK.B
- KO, PEP, MDLZ
- PG
CAT

Down hard the past two days, CAT is a recent relative strength stock. It’s dipping to the Q4 high, as well as the rising 21-day and 50-week moving averages.
NO buying and hoping. If it can’t hold, leave it alone. An open at or near the 21-day and move back through $216.50 would be most attractive.
DE
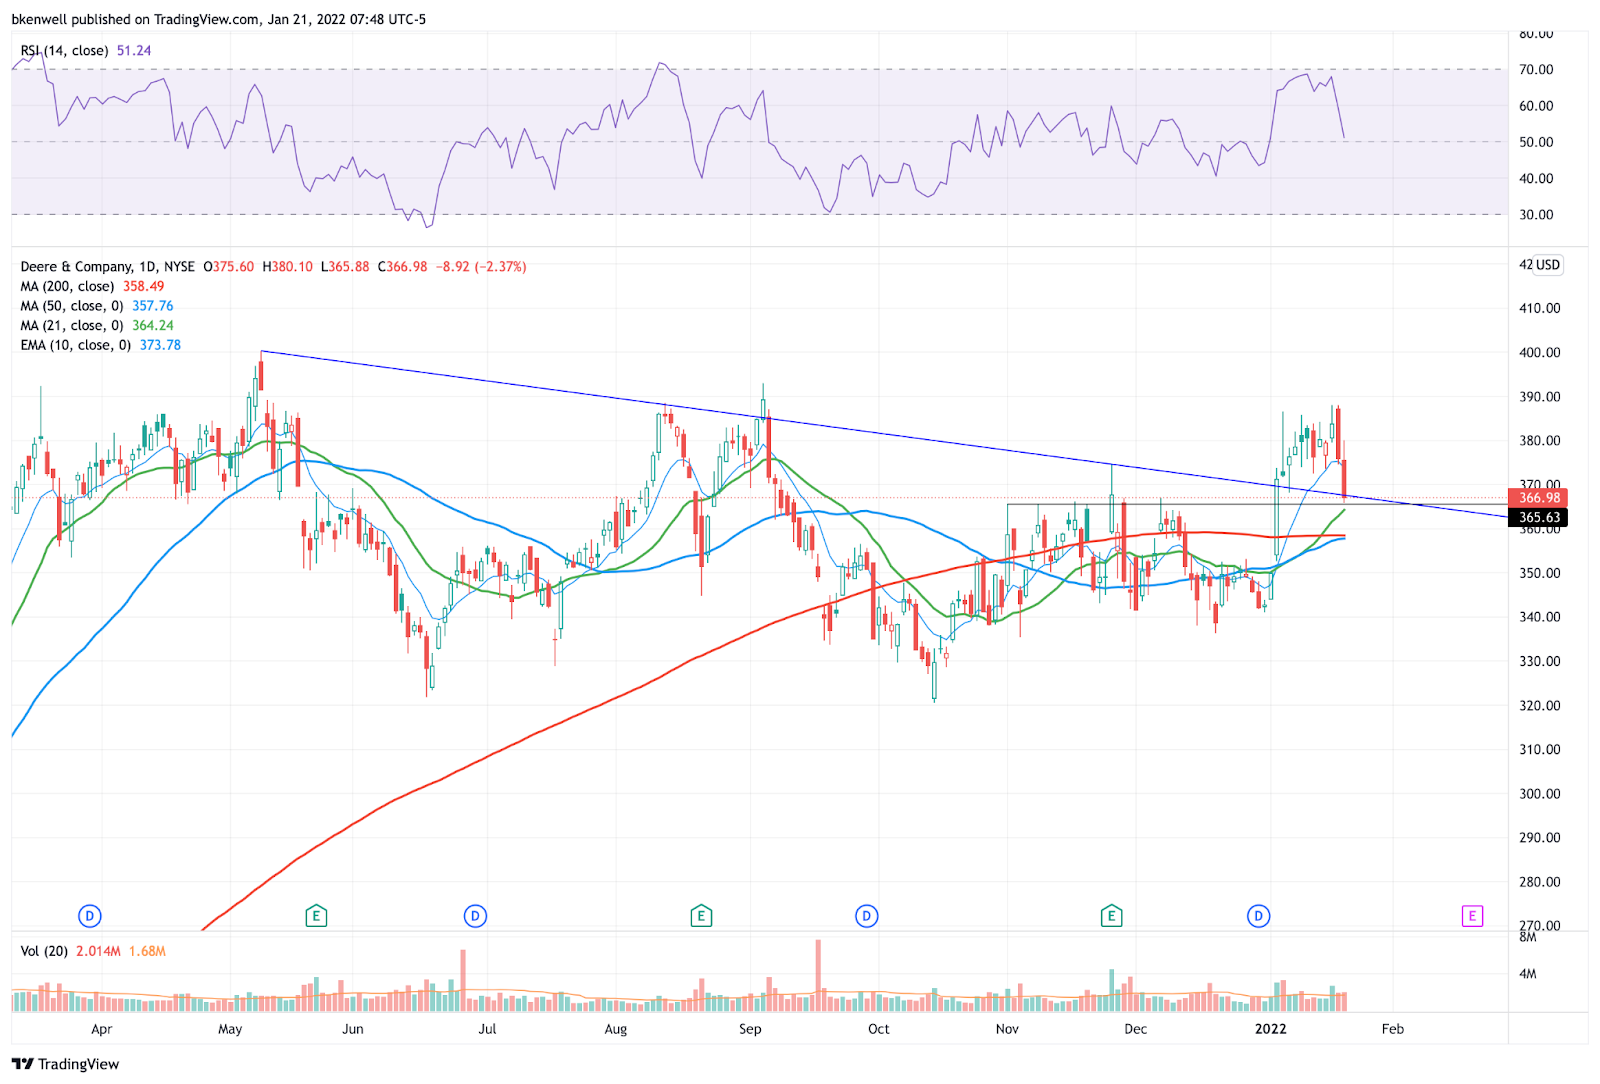
Same thing as CAT. Recent relative strength trade, back into the breakout level and rising 21-day.
If $364 can’t hold, $358 may be on the table.
ROKU

This one is definitely #NoHero
Growth stocks have been under assault and Roku is not an exception. After 3 doji sticks in a row — which is rare — it looked like ROKU was going to bounce. It did, but then it was rejected by the 10-day.
Gapping lower now, shares are trading below last week’s low of $159.76 in the pre-market.
I would love an open below this level and a quick reclaim of it. The hope would be something like a low of $159.26 and a reclaim of last week’s low.
That would let me get long with a stop-loss of 50 cents a share and look for some sort of bounce.
This is not a risk-free trade. Far from it. If you are not comfortable with it, do not take it. And if the risk range becomes too wide, it ruins the R/R setup and that’s fine — we walk away.
Energy
May get our first test of the 10-day in quite some time. If that’s the case, then look at the XLE (above), as well as some of our oil names from the Go-To list.

Disclaimer: Charts and analyses are for discussion and education purposes only. I am not a financial advisor, do not give financial advice and am not recommending the buying or selling of any security.
Remember: Not all setups will trigger. Not all setups will be profitable. Not all setups should be taken. These are simply the setups that I have put together for years on my own and what I watch as part of my own “game plan” coming into each day. Good luck
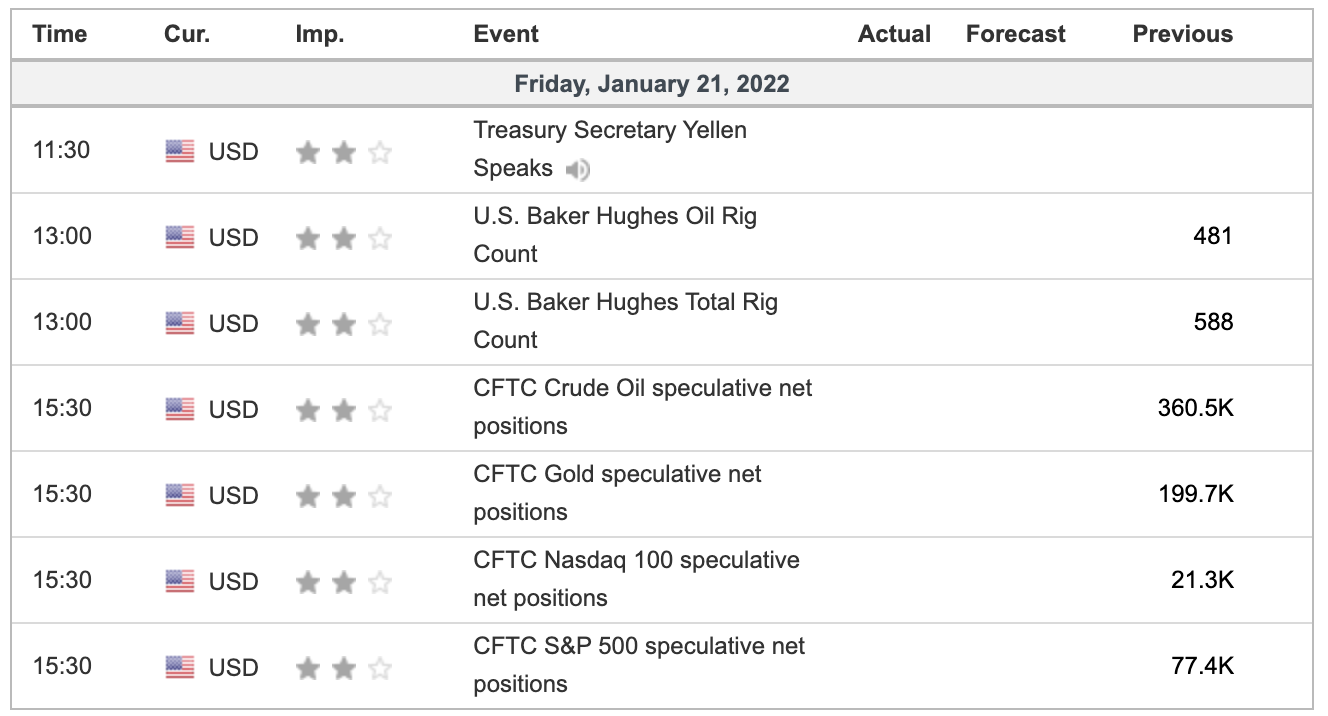
Economic Outlook
Comments are closed