Follow @MrTopStep and @BretKenwell on Twitter and please share if you find our work valuable.
Our View
I am not the least bit surprised at how the markets fell yesterday and nor should anyone else. I am not going to repeat what I have said over and over. What I will say is, I had lunch with the PitBull at his country club and I told him that “we have seen market selloffs and crashes since we met almost 35 years ago and that we have never seen anything like this selloff/bear market,” something he agreed with as well.
I always go back to the bear market of the 1970s and how the S&P sold off, rallied hard and then went to new lows. I still think that is a real possibility.
I know many of the bulls may think I only write negatives but that’s not really true. I am and always will be a bull-market guy, but I just think this bear market is going to last longer.
Our Lean
I’m sure you have heard of this rule — I used it earlier this week — that the ES tends to go sideways to higher after a big down day. I am a little hesitant, but if the ES gaps lower I may buy the open or the first selloff after the gap lower. If that’s the case, it will be a small position, because…
My Overall Lean
is to sell the rallies.
At lunch, the PitBull mentioned that he thinks we could see the Thursday/Friday low the week before the monthly Opex. I am torn in that regard. While I do like that setup — and it paid off BIG time last month — we are on Day 2 of Powell today and have the jobs report Friday.
As always, we’re taking it trade by trade and right now, my lean is to sell the bigger rallies. Levels below on chart.
MiM and Daily Recap
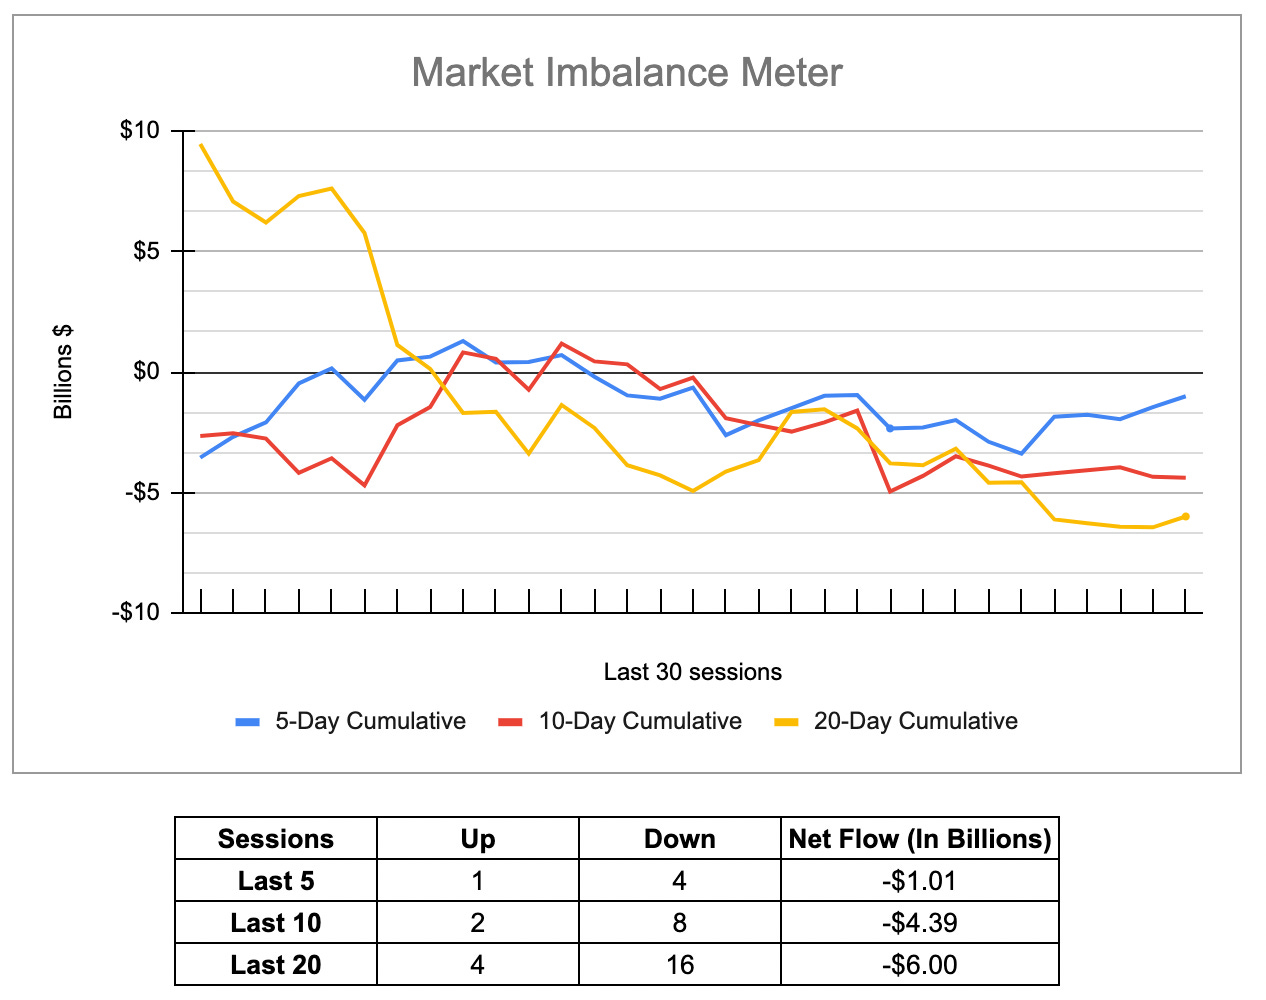
The ES traded up to 4064.50 on Globex and opened Tuesday’s regular session at 4051.25. After the open, the ES traded up to 4054 and then Powell comments came out at 10:00 and the ES dropped to 4012.25 at 10:10. From there, they popped up to 4039.50 at 10:35, dropped to new lows of 4004.25 at 12:05 and then popped back up to 4027. It was a messy, choppy session.
Ultimately, the ES went back down to new lows of 3982.50 at 2:55, traded back up to 3998 at 3:35, then traded 3987.50 at 3:50 as the cash imbalance showed $550 million to sell. The ES traded 3989.75 on the 4:00 cash close, traded between 3988 and 3992.50 after 4:00 and settled at 3991 on the 5:00 cash close, down 61.50 points or 1.5% on the day.
In the end, the Fed has time and time again said that its path was higher rates and Powell re-enforced that yesterday. In terms of the ES’s overall tone, it was weak. In terms of the ES’s overall trade, volume was on the high side at 2.07 million contracts traded, it’s highest total since 2/14.
Technical Edge —
-
NYSE Breadth: 16% Upside Volume (!)
-
Advance/Decline: 20% Advance
-
VIX: ~$20
Remember, Powell @ 10:00 am ET.
S&P 500 — ES
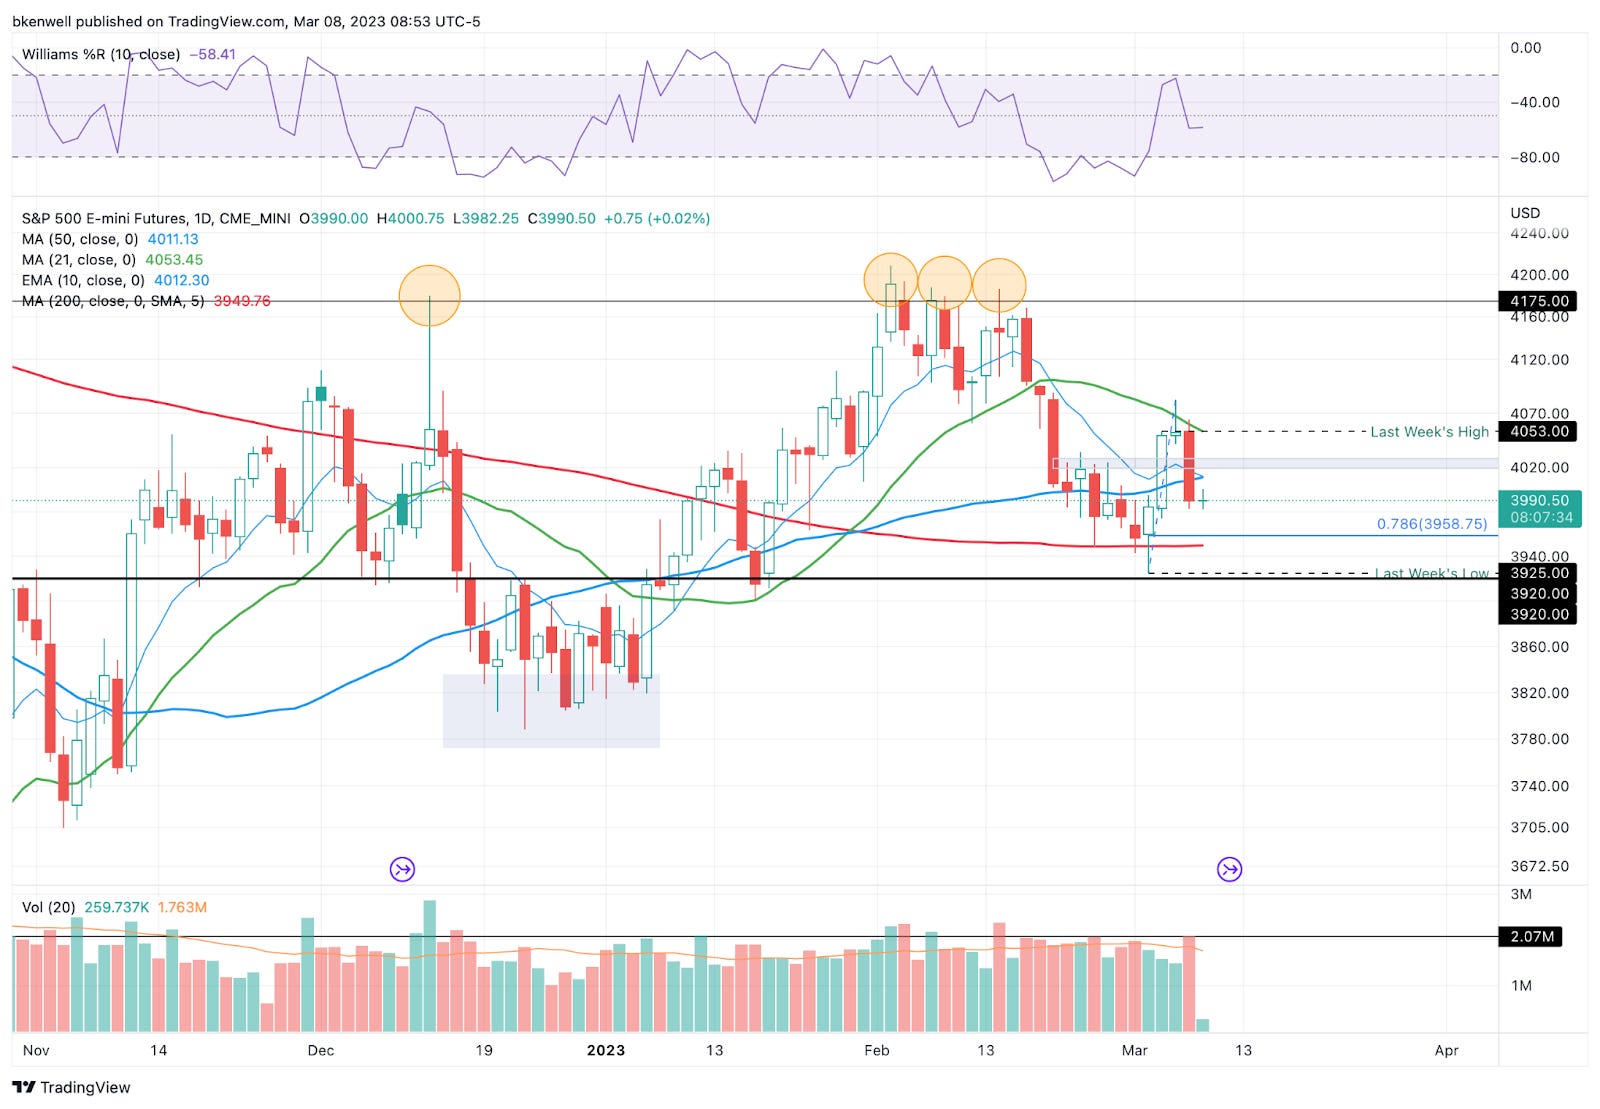
Super sloppy overnight action. For now, 4000-4010 is resistance. Above that and 4025 is the next layer of resistance on our chart.
On the downside, ~3980 is the pivot. Above it is constructive, below it is a concern.
If we break 3980 to the downside and fail to regain it, 3950 to 3959 is in play.
SPY
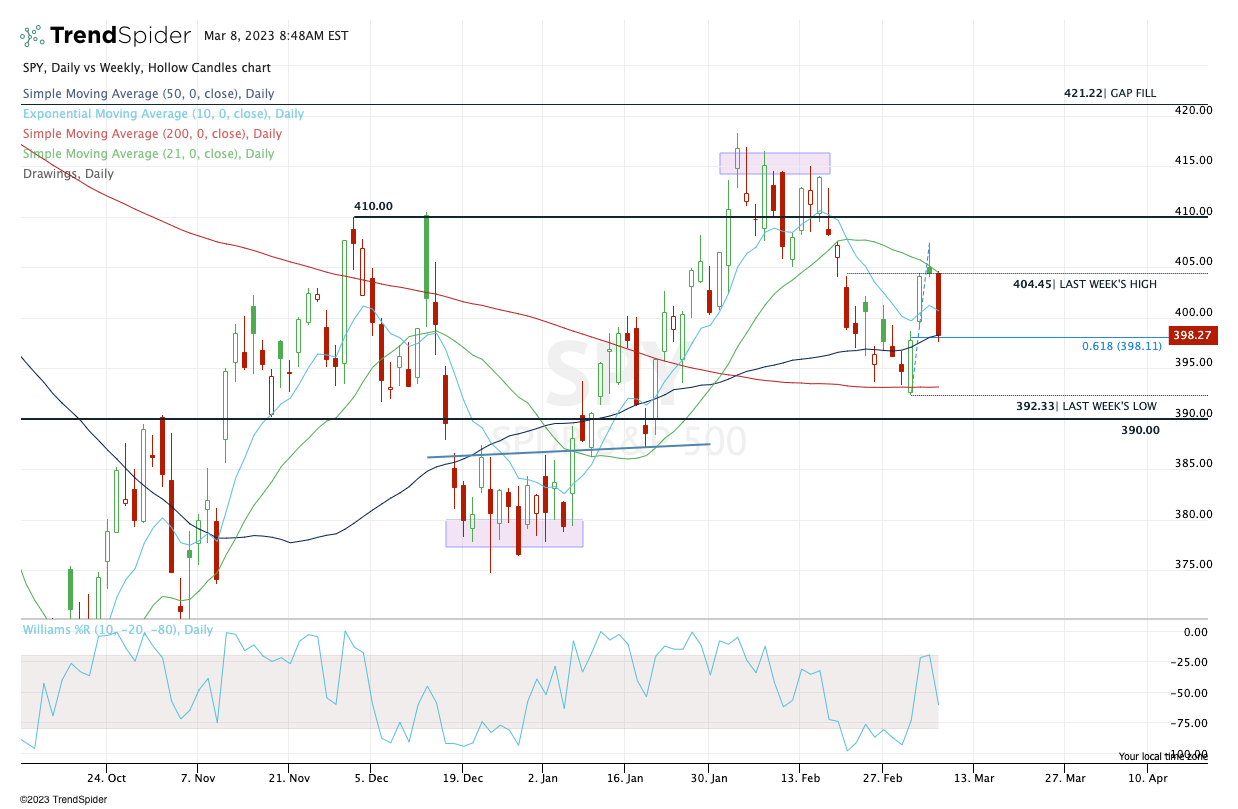
SPY went daily-down below $404 and is (for now) holding that 61.8% retracement of the rally and 50-day moving average near $398.
That level is pretty damn key in my view.
Daily-down below $397.63 that doesn’t reverse higher opens the door to more downside. Specifically, the mid-$393s could eventually be in play, along with last week’s low at $392.33.
TLT
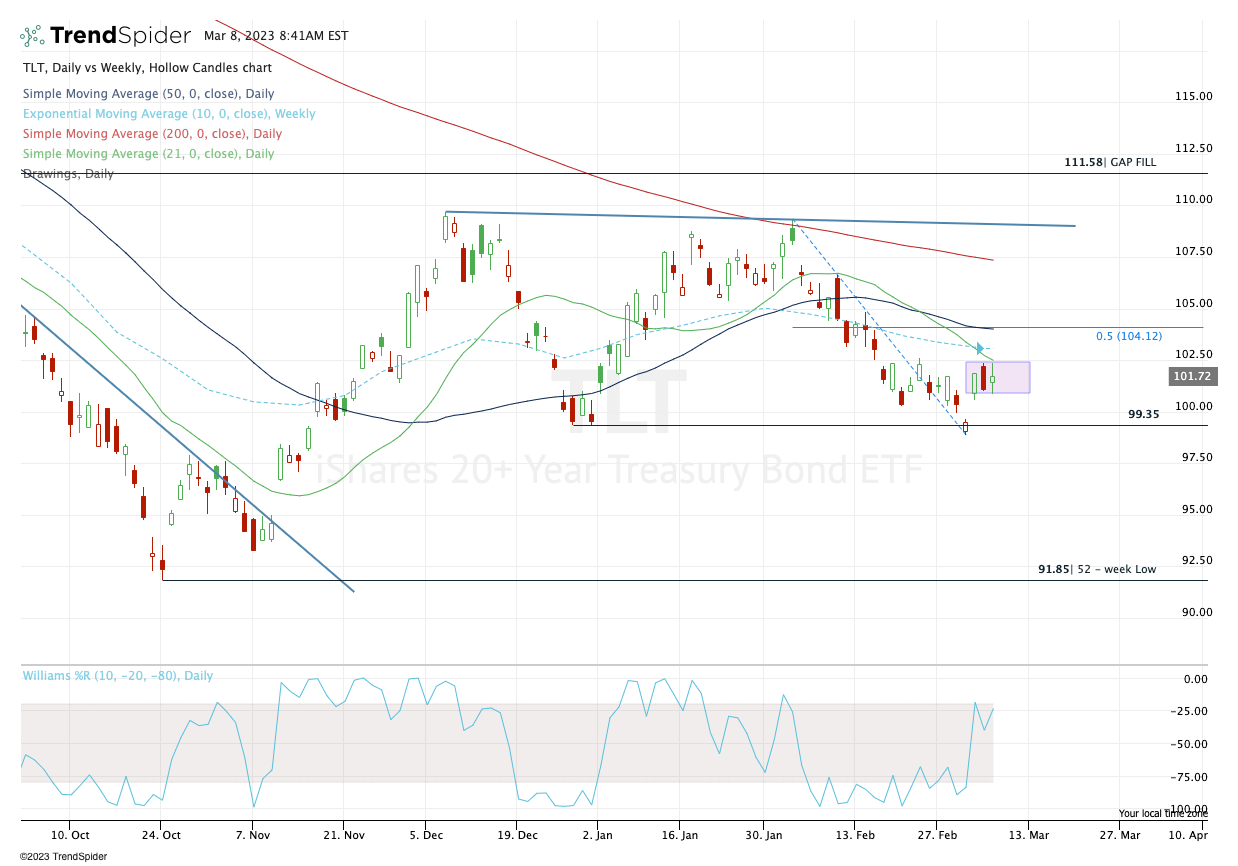
The reaction in bonds could be telling for the (eventual) reaction in equities.
The TLT is forming a fairly tight two-day range between $100.88 and $102.35. If it can push through the high, $103.25 is next, followed by $104. The latter has the 50-day and 50% retracement near it.
On the downside, a break of $100.88 and failure to regain it puts the gap-fill in play at $99.64.
Open Positions
-
Bold are the trades with recent updates.
-
Italics show means the trade is closed.
-
Any positions that get down to ¼ or less (AKA runners) are removed from the list below and left up to you to manage. My only suggestion would be B/E or better stops.)
-
** = previous trade setup we are stalking.
-
MRK — Long from ~$110 and now on the verge of monthly-up! — Ideal stop is clearly defined near $105. Initial target for ⅓ trim is $112.50.
-
DD — Long from $72.50. Down to ½ position. Prefer a ⅓ trim at $76.50+
-
Stop at $71 or B/E, whichever you prefer.
-
-
Natural Gas, UNG or /NG — First target hit at UNG ~$10 and NG at 2.95 to 3.00.
-
Now /NG needs to hold the $2.40 to $2.50 mark in order for bulls to stick with this one. If it holds, I would love to see Friday’s highs hit again (the target of our prior trim).
-
-
AMD — Long on weekly-up over $81.63 — Got our first ⅓ trim yesterday at $84+. Can now raise our stop-loss to a much more comfortable ~$80 or B/E For those that don’t want to risk any losses after our first trim.
-
SMCI — Did not give us the daily-up close over $100, or even a 30-min close above this level for that matter. If you took:
-
$94 Stop. $104 to $105 target.
-
If you didn’t, wait for another move over $100 and preferably with a daily close above this mark.
-
Go-To Watchlist
*Feel free to build your own trades off these relative strength leaders*
Relative strength leaders →
-
NVDA, CRM
-
PANW, FTNT
-
SMCI, AVGO
-
WYNN, LVS → would love a reset to the 10-week ema
-
GE → would love a reset to the 10-week ema
-
FSLR
-
AQUA
-
TSLA
-
SBUX, ULTA, NKE
-
AEHR → volatile!
-
MELI
-
AXP → would love a reset to the 10-week ema
-
BA & Airlines — AAL, DAL, UAL
-
CAT
Guest Post
Topic: Taylor 3 Day Cycle
Author: David D Dube’ (a.k.a. PTGDavid)
Prior Session was Cycle Day 2 (CD2): Normal CD2 was interrupted as JPOW’s Senate Banking Committee hawkish testimony sent shock waves that reverberated throughout the markets, closing near lows of the session. Prior range was 82 handles on 2.034M contracts exchanged.
…Transition from Cycle Day 2 to Cycle Day 3
This leads us into Cycle Day 3 (CD3): Price is currently below CD1 Low (4041.75) as sentiment momentum has shifted back to “risk-off”. Structure is broken, so additional downside is clearly a vulnerable scenario. As such, scenarios to consider for today’s trading.
Bull Scenario: Price sustains a bid above 3990, initially targets 4015 – 4020 zone.
Bear Scenario: Price sustains an offer below 3990, initially targets 3975 – 3970 zone.
PVA High Edge = 4022 PVA Low Edge = 3983 Prior POC = 3990
*****The 3 Day Cycle has a 91% probability of fulfilling Positive Cycle Statistics covering 12 years of recorded tracking history.
For more detailed information for both bullish and bearish projected targets, please visit: PTG 3 Day Cycle and/or reference the Cycle Spreadsheet below:
Link to access full Cycle Spreadsheet > > Cycle Day 3 (CD3)

Thanks for reading,
PTGDavid
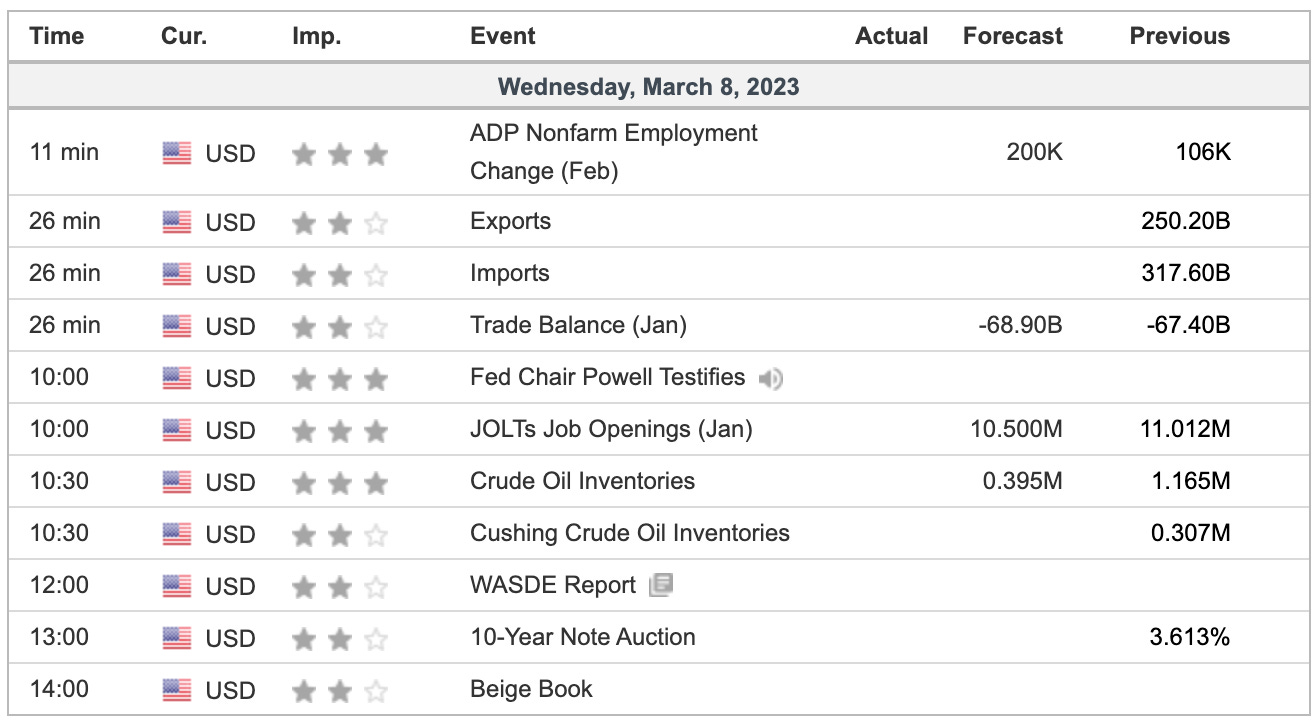
Economic Calendar
No responses yet