Follow @MrTopStep and @BretKenwell on Twitter and please share if you find our work valuable.
Our View
I want to take a break from the “View” today and change gears a little bit. A friend of mine, Cary from Artac Advisory, posted this great video yesterday talking about the continued strength in the US Dollar.
As you know, the Dollar has been having a big impact on equities lately and I would suggest giving the video a watch sometime today.
Further, I’m not sure how many of you are familiar with Larry McDonald, but he is the author of “A Colossal Failure of Common Sense” and is the founder of The Bear Traps Report.
Even if you’re not a big macro buff — I’m not necessarily, but I do find it interesting — it’s easy to acknowledge that McDonald has done some great work in this arena.
Just recently, he pointed to a worrying development.
“Our 21 Lehman systemic risk indicators that look at equity and credit point to one of the highest probabilities of a crash in the stock market looking out 60 days…when we deteriorate in jobs the next two, three months, that will bring into question the S&P earnings, and the S&P earnings are probably $190 [versus estimates of $226], so that’ll trigger it.”
Our Lean
I don’t know if that will really be the case, re: a stock market crash in the next two months. But I firmly believe this mess isn’t over yet.
Last fall, everyone was perma-something, either believing completely that the market was going back to all-time highs or going down to 3,000 in the S&P. I said, “What if we stay range-bound, with no new highs or lows in the next year?”
That would be the pain trade as both bulls and bears get toasted and frustrated waiting for the move that never comes. Of course, eventually the bulls will win out, but it won’t be immediately, IMO.
This has been one long ugly week. The YM rallied 1070 points from Thursday’s low to Monday’s high and has now given back 960 points. The ES rallied 157 handles and has given back 110 points, while the NQ rallied 654 points and has given back 378 points.
My analysis shows that the YM has major resistance at 33,020, which is 200 points from here.
Next Friday is Opex, which has us looking for a trade-able low sometime today or tomorrow — that’s the PitBull’s Thursday/Friday low before Opex.
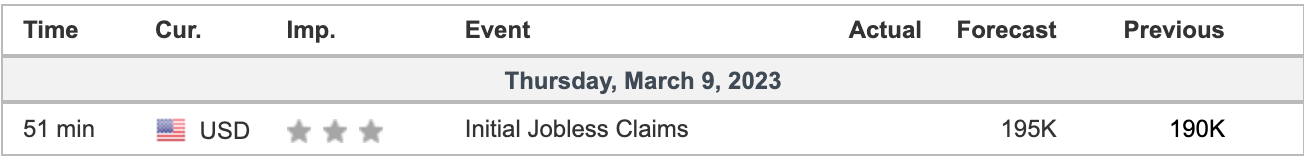
That being said, we just got done listening to two days worth of Powell commentary and it’s clear that “higher than expected” and “higher for longer” are both on the table (and likely) in regards to rates. Plus we have the jobs report tomorrow.
This week ain’t easy, folks.
Our Lean: It’s hard to rule out a further decline, but we’re on the look for a possible bounce today. If breadth is poor and we are rallying, looking to sell the 30 to 40 point rallies. Levels below on Chart.
MiM and Daily Recap
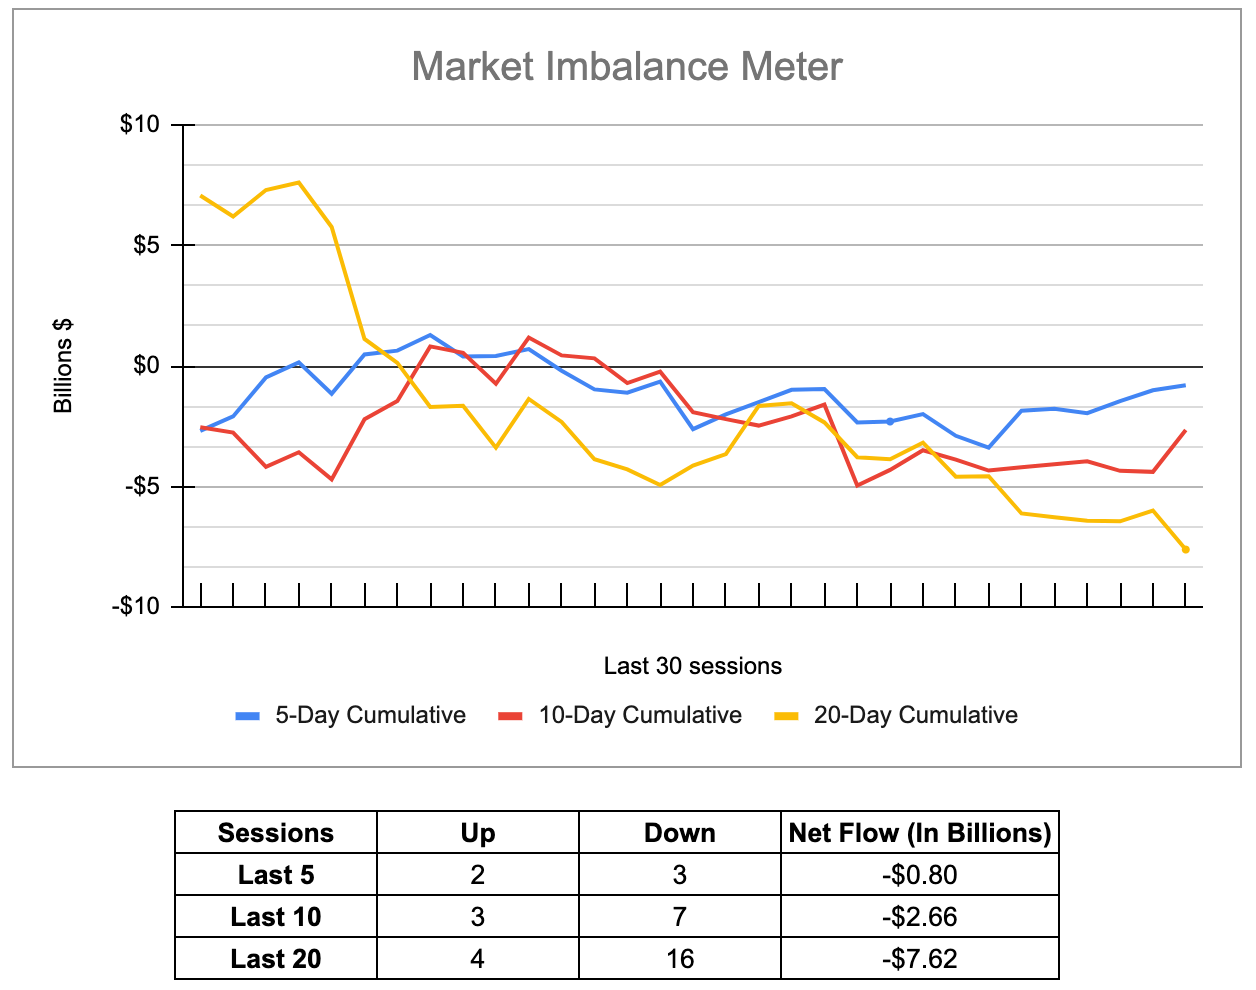
The ES traded up to 4000.25 on Globex and opened Wednesday’s regular session at 3990.25. After the open, the ES traded up to 3997.25 and sold off down to 3974.25 and traded right back up to a new high at 4003.25 at 10:36. From there, it traded down to 3983.25 at 11:35, shot up to the high of the day 4003.25 at 11:50, then dropped down to new lows for the day at 3971.50 at 1:50.
It was whip-saw city, as the ES rallied back up to 3986 at 2:35, fell down to 3975.50 at 3:25, then erupted off the low. The ES climbed 20 points up to 3995 at 3:50 as the imbalance showed $242 million to buy and traded 3995.50 at the 4:00 cash close. After 4:00, it continued higher, settling at 3998.25 at the 5:00 futures close, up 8.5 points or 0.21% on the day.
In the end though, it was dead. In terms of the ES’s overall tone, the best way to describe it was wishy-washy. In terms of the ES’s overall trade, volume wasn’t that bad considering the range was only 32 points, with volume at 1.8 million contracts traded.
Technical Edge —
-
NYSE Breadth: 48% Upside Volume
-
Advance/Decline: 50% Advance
-
VIX: ~$19.50
Yesterday was slop-city, as the S&P spent most of the day chopping in a relatively tight range, going nowhere fast. Even the late-day rip left it near unchanged on the day, while breadth was basically 50-50.
That does give us something to navigate on the daily chart though, given that we were left with a sort of indecision candle.
It’s encouraging that semiconductors keep trading so well. We have been able to punch out some profit in this space and it’s also a bullish indicator that they are trading well. Although banks have been trading poorly, kind of negating that observation a bit.
S&P 500 — ES
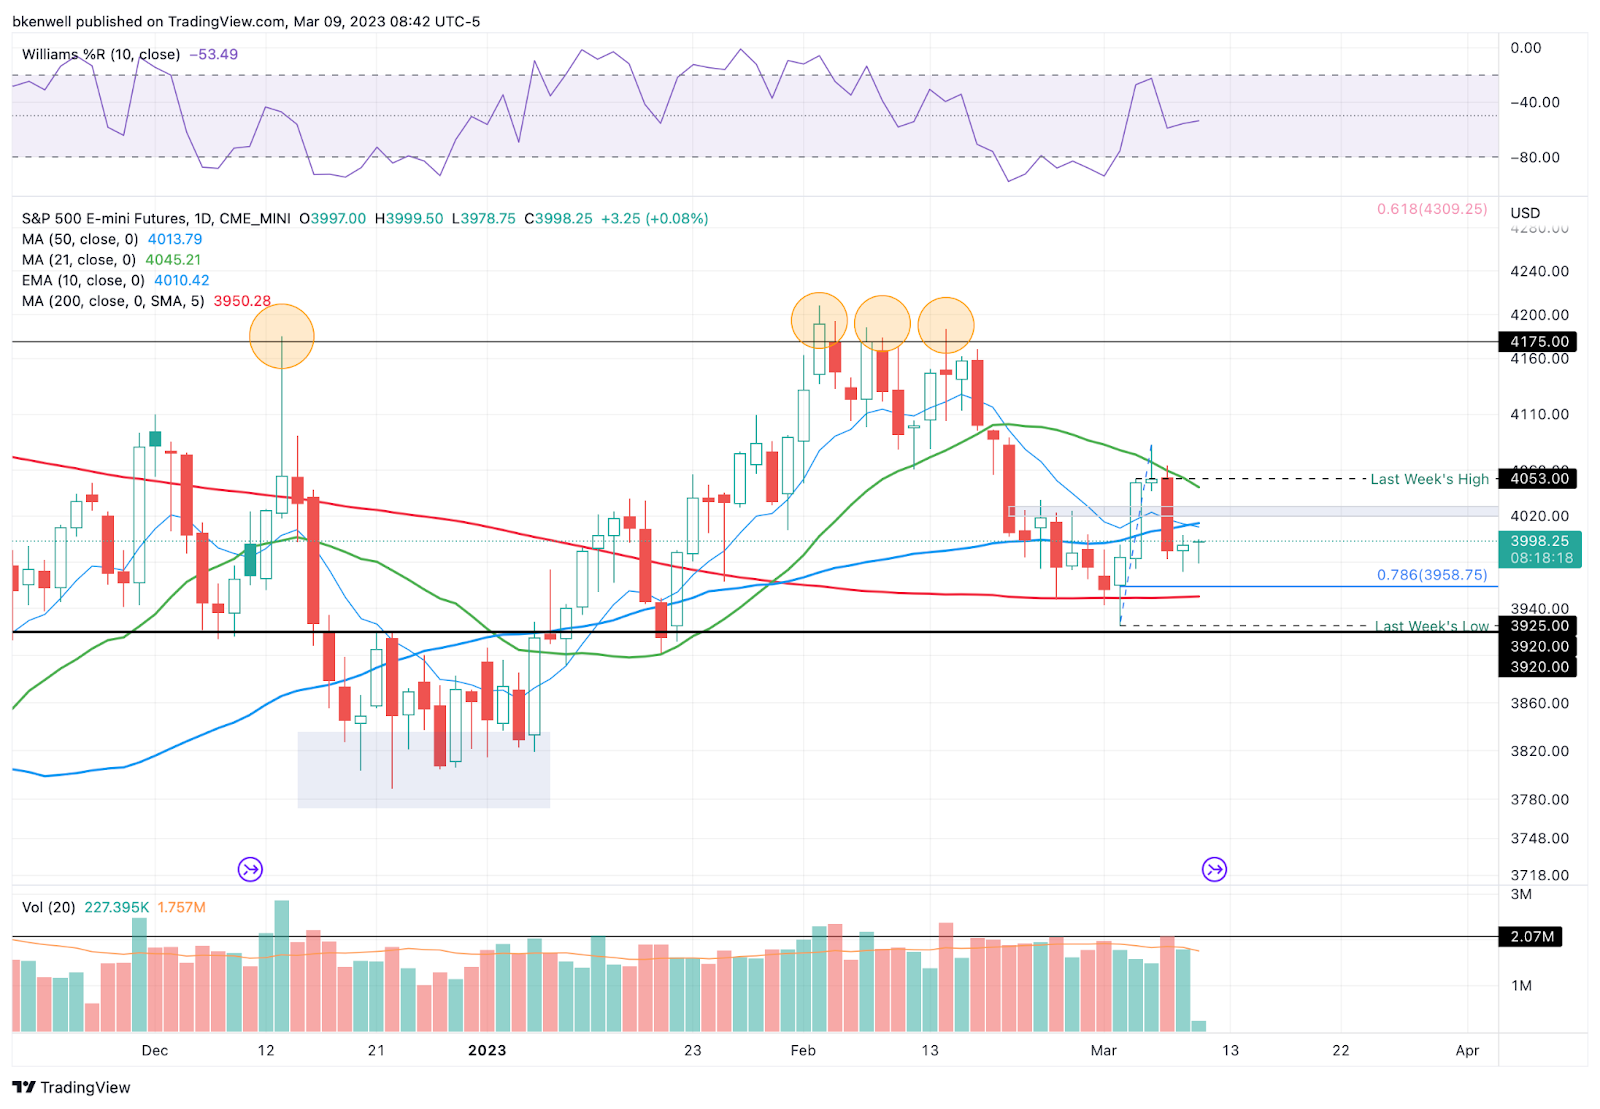
For now, 4000-4010 is still resistance. Above that and 4012 and 4027 are the next layer of resistance on our chart (that’s the 10-day + 50-day combo, then the 50% retracement, respectively).
On the downside, ~3980 is still the pivot. Below it puts yesterday’s low in play at 3971.50. Below that puts 3950 to 3959 is in play.
SPY

Sloppy action on SPY yesterday but a trade-able setup today.
Daily-up over 399.71 and over $400 is a big hurdle. If it can do so though, $402, then $404 to $404.50 are in play.
Daily-down below $396.50 — notice how this level remains relevant — that doesn’t get reclaimed opens the door down to the mid-$393s, then possibly last week’s at $392.33.
CRM
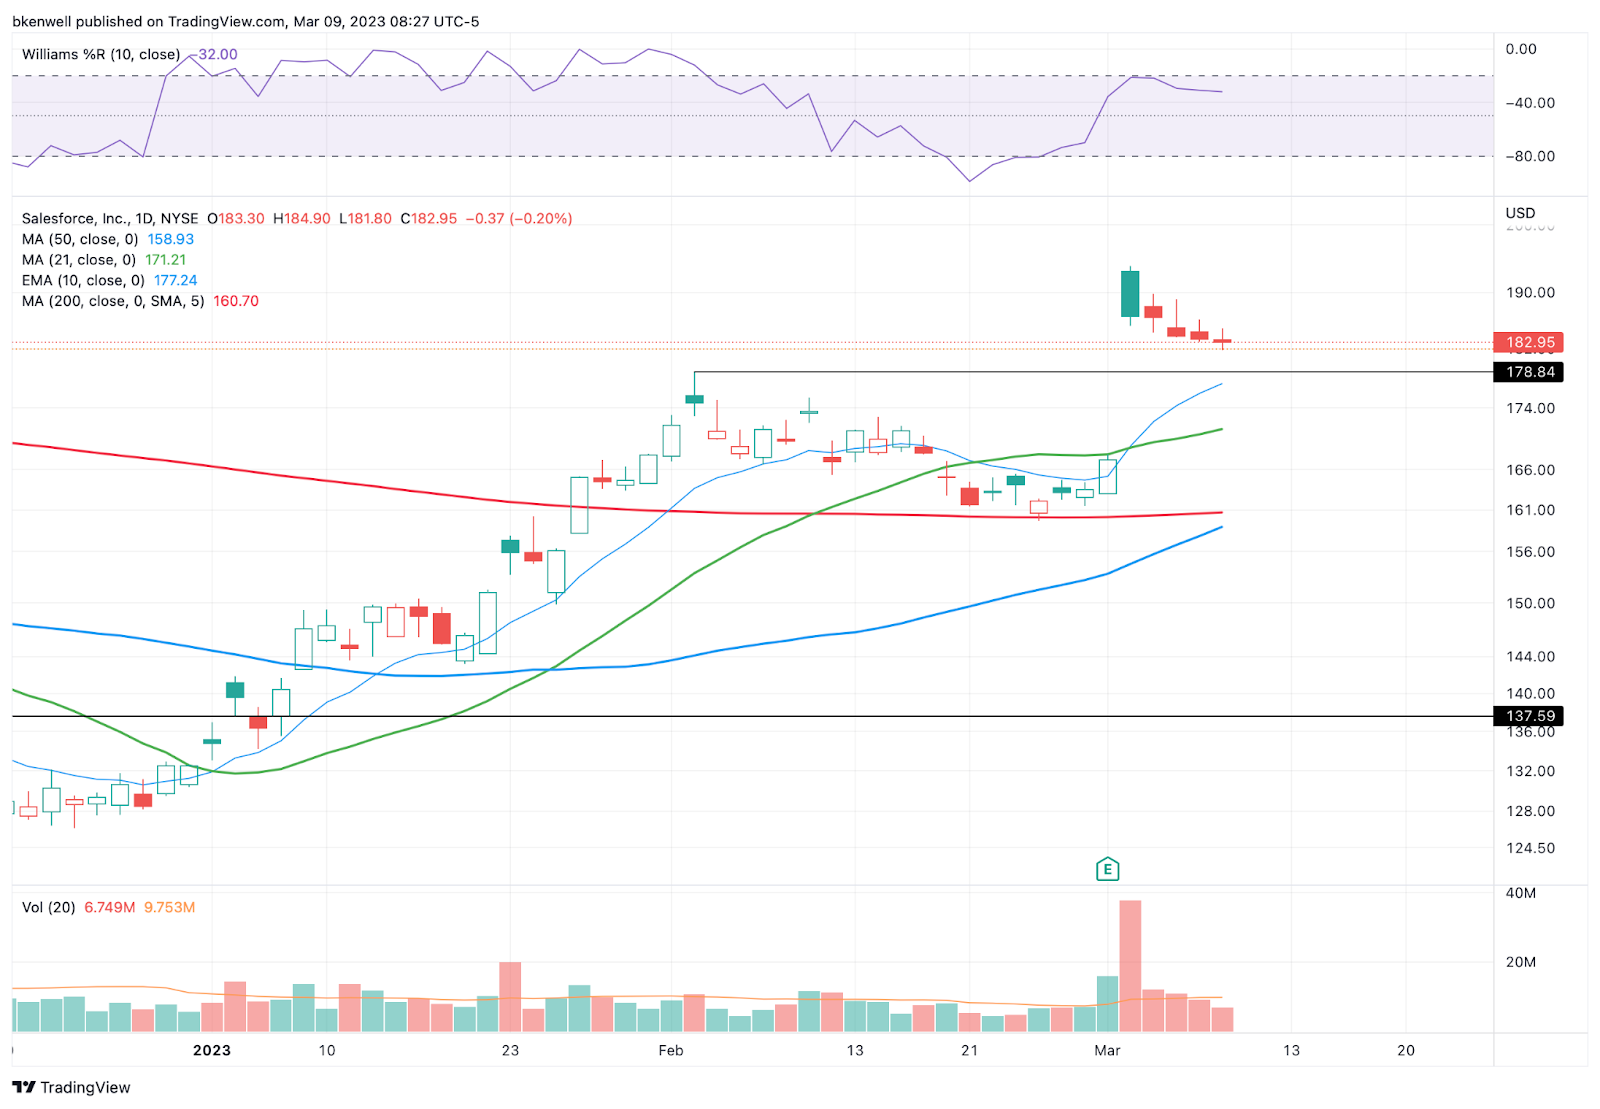
I don’t love the “sell, sell, sell!” action in CRM since its post-earnings pop, but it did gap right into resistance on that move (on a weekly basis).
Now looking for a retest down to the $175 to $178 area, the former February high and the rising 10-ema.
In this scenario, I would like calls as my risk is simply the debit paid for the position. If the buyers really step in, CRM shouldn’t go below $173 to $174, so use that to gauge your risk if you’re trading common over options.
AVGO
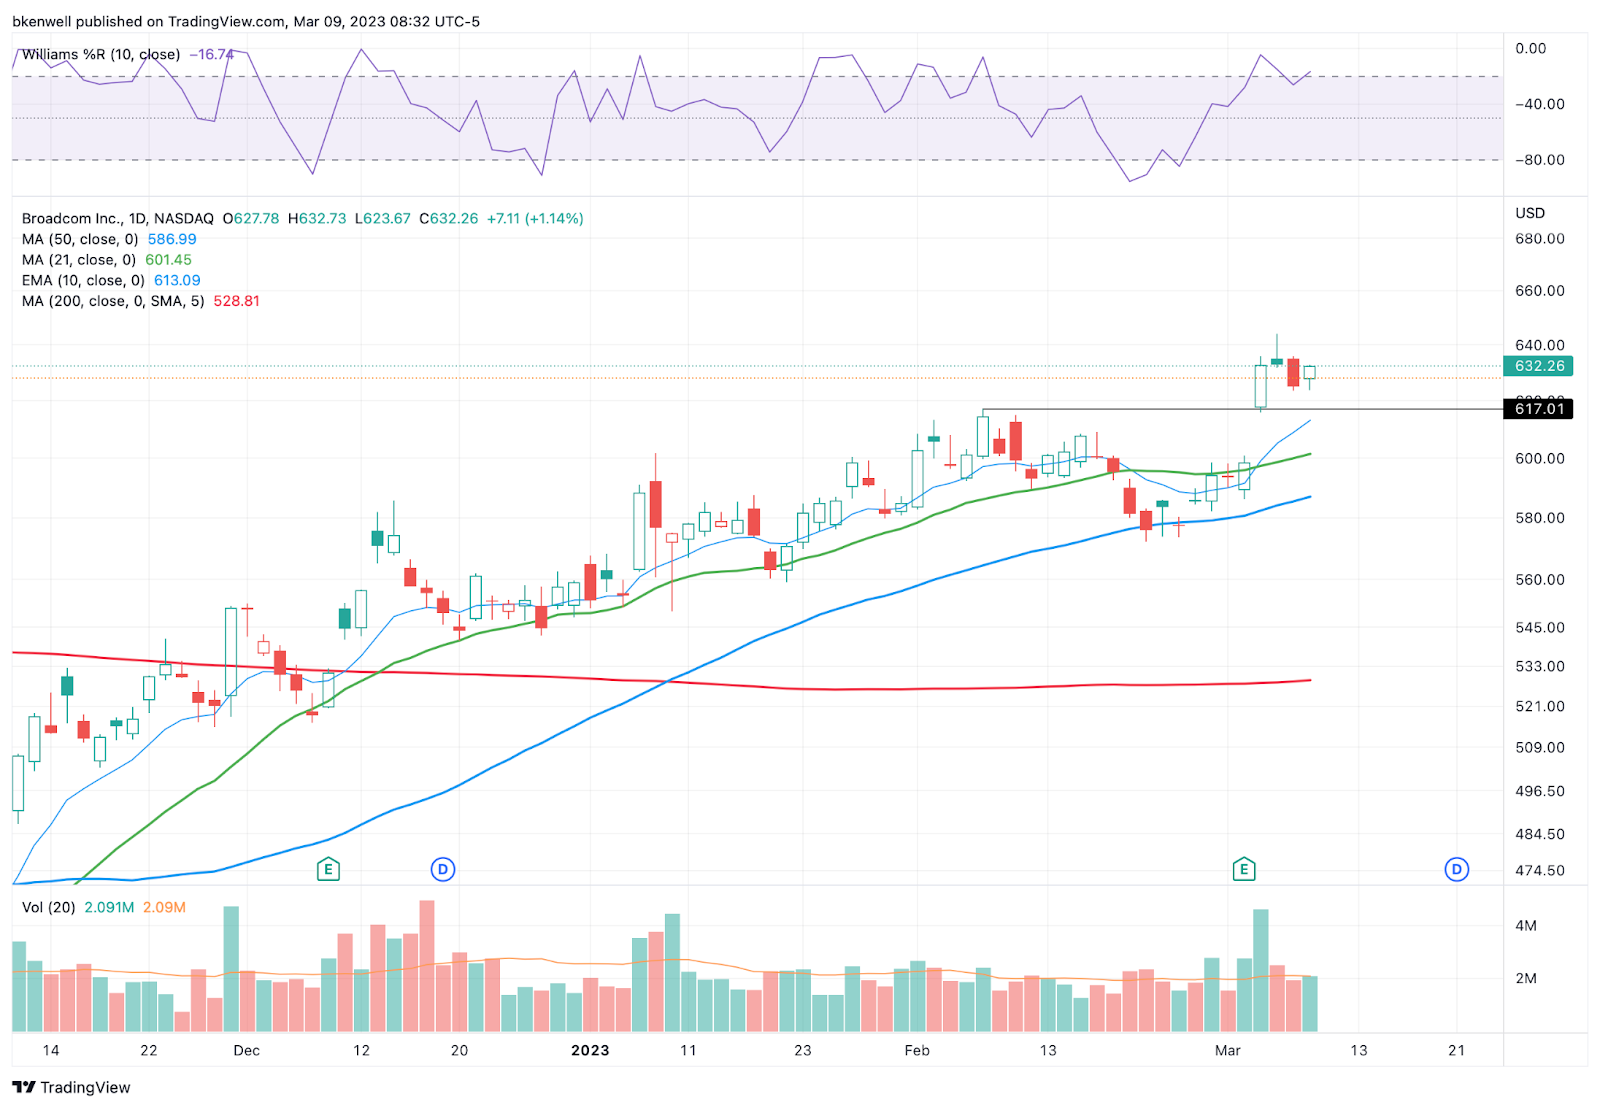
Same setup as CRM. Watching a retest back to resistance and the 10-ema near $615 to $617.
$600 is a reasonable stop, about 2.5% risk. I like calls in this regard, as risk is simply whatever debit we pay.
Open Positions
-
Bold are the trades with recent updates.
-
Italics show means the trade is closed.
-
Any positions that get down to ¼ or less (AKA runners) are removed from the list below and left up to you to manage. My only suggestion would be B/E or better stops.)
-
** = previous trade setup we are stalking.
-
MRK — Long from ~$110 and now on the verge of monthly-up! — Ideal stop is clearly defined near $105. Initial target for ⅓ trim is $112.50.
-
Natural Gas, UNG or /NG — First target hit at UNG ~$10 and NG at 2.95 to 3.00.
-
Now /NG needs to hold the $2.40 to $2.50 mark in order for bulls to stick with this one. If it holds, I would love to see Friday’s highs hit again (the target of our prior trim).
-
-
AMD — Long on weekly-up over $81.63 — First ⅓ trim yesterday at $84+, Second trim at $85.50.
-
Can now raise our stop-loss to a much more comfortable B/E. $86 and $88 are the next upside trim spots.
-
-
SMCI — Daily up over ~$100. $94 Stop. $104 to $105 target (just shy of this yesterday!)
-
If you so desire, can go to a B/E stop even though we did not achieve our first price target. I will not be doing that, I am at peace with the outcome of the trade, but we almost tagged our target yesterday and had a wide initial stop, so no shame in stopping out if this setup fails and we can re-evaluate it in the future.
-
Go-To Watchlist
*Feel free to build your own trades off these relative strength leaders*
Relative strength leaders →
-
NVDA, CRM
-
PANW, FTNT
-
SMCI, AVGO
-
WYNN, LVS → would love a reset to the 10-week ema
-
GE → would love a reset to the 10-week ema
-
FSLR
-
AQUA
-
TSLA
-
SBUX, ULTA, NKE
-
AEHR → volatile!
-
MELI
-
AXP → would love a reset to the 10-week ema
-
BA & Airlines — AAL, DAL, UAL
-
CAT
Economic Calendar
No responses yet