Follow @MrTopStep and @BretKenwell on Twitter and please share if you find our work valuable.
Our View
Can the ES rally further? I guess. The ES rallied up to 4208.50 and sold off down to 3925.00. The 50% retracement of the move is ~4067, which we hit yesterday before the fade.
They are not always right, but I do think the Mr. Top Step rules really are handy to keep around. Yesterday’s approach “that the ES tends to go sideways to down after a big up day” proved prudent, with it ending higher by less than 3 points.
At this point, I don’t think there is much to say that we don’t already know.
Maybe today we will hear something different for Jerome Powell, but I say the odds are slim. I said months ago that as the summer rolls in, the Fed will be closer to ending its rate hikes and I still believe there will be an opportunity to get long for a larger rally. However, I also believe the price action we are seeing right now has not changed.
Have you looked at mortgage rates recently? The 30-year rates are back up to the 7% mark, just shy of the highs from a few months ago. Here in Florida things have slowed, but there also has been some big price drops. We are only 2 months into 2023 and I think the best and the worst is still yet to come.
Keep your chin-straps close!
Our Lean
I have to be honest about this, I have had a decent start to the year but I have missed some big trade opportunities.
Last Friday was one and yesterday I had it right as well. I didn’t think the rally would hold, but I sold too early and got out too early and then watched the ES reverse lower. I had a 4083.50 stop in and 4082.50 was the high. I find it hard to recover from mistakes like that — mentally, that is.
The PitBull agrees; you have to stand in front of freight trains to make money and that goes along with my trading methodology of selling into strength and buying into weakness, which is a hard way to go sometimes.
This is my reminder to you: I have been in this game for decades, not years, and keeping your mental capital is as important or sometimes more important than your account capital. This game can be draining and if you don’t take time to recharge, you will burn through your mental capital and your account capital will be next.
Our Lean: If the ES is any good, it will need to do some back-and-fill for a few days. The levels we are watching are 4040, 4010 and 3990. On the upside, they are 4075, 4085-4090 and 4120. After a not-so-good day yesterday, I am going to be much more patient and wait for the good setups. I want to see the reaction to the Fed headlines.
MiM and Daily Recap
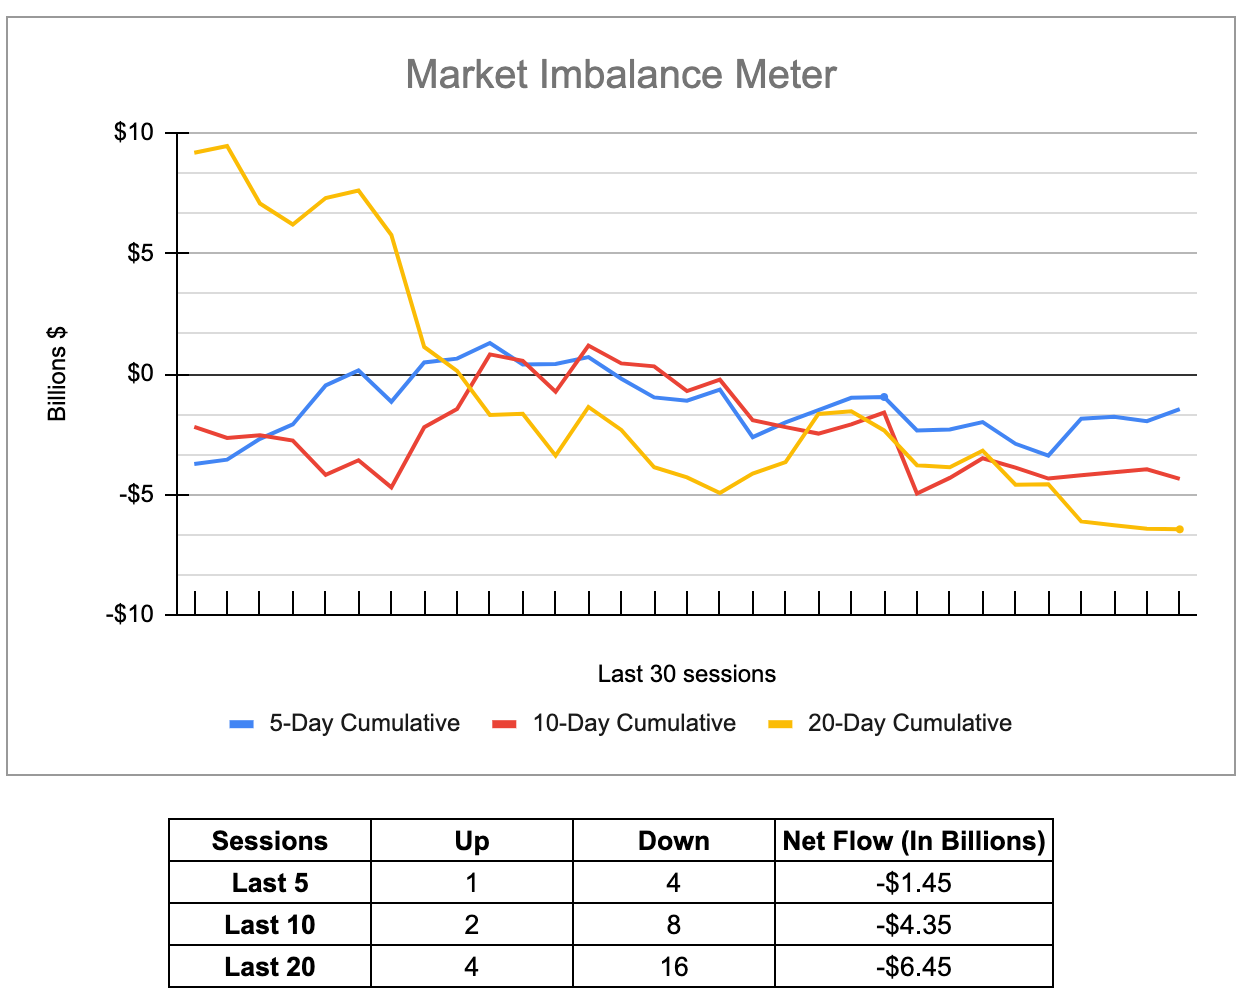
The ES traded up to 4066.50 on Globex and traded 4057.75 on Monday’s regular session open before trading up to 4078.25 at 10:18. After the high, the ES sold off all the way back down to 4051.75 at 3:04. After the low the ES rallied up to the 4057 level at 3:14 and then reversed down to a new low at 4048 at 3:30. I could do all the zigs and zags, but there really wasn’t much to recap.
The ES traded 4054.75 as the 3:50 cash imbalance showed $775 million to sell, traded down to 4051.25 and traded 4052.25 on the 4:00 cash close. After 4:00, the ES traded up to 4055 and settled at 4053.75 on the 5:00 futures close, up just 2.75 points on the day.
In the end, it was thin to win early then a slow grind back down. In terms of the ES’s overall tone, it was a two-way street. In terms of the ES’s overall trade, volume was steady at 1.5 million contracts traded.
Technical Edge —
-
NYSE Breadth: 35% Upside Volume
-
Advance/Decline: 35% Advance
-
VIX: ~$18.75
Today is Day 1 of the Powell testimony. I’m not sure how that will be handled in regards to the market, as it’s not a prepared speech to economists and market participants.
There will likely be your typical headline-algos that rip-and-dip the S&P based on some of Powell’s responses.
If we can get some flushes and rips to the edge of the range, some nice reversal trades could be in play. Otherwise, try to drown out the noise and just trade what’s in front of you. If that’s too hard, always remember that you don’t have to trade — especially when the environment is not ideal for your style!
**
Note: Yesterday’s fade was not hard to see coming, with the way the 10-year yield was rallying and as the VIX was up over 1% even amid the S&P’s rally. Keep those in your back pocket. At best, it suggests to use some caution and trade smaller.
S&P 500 — ES
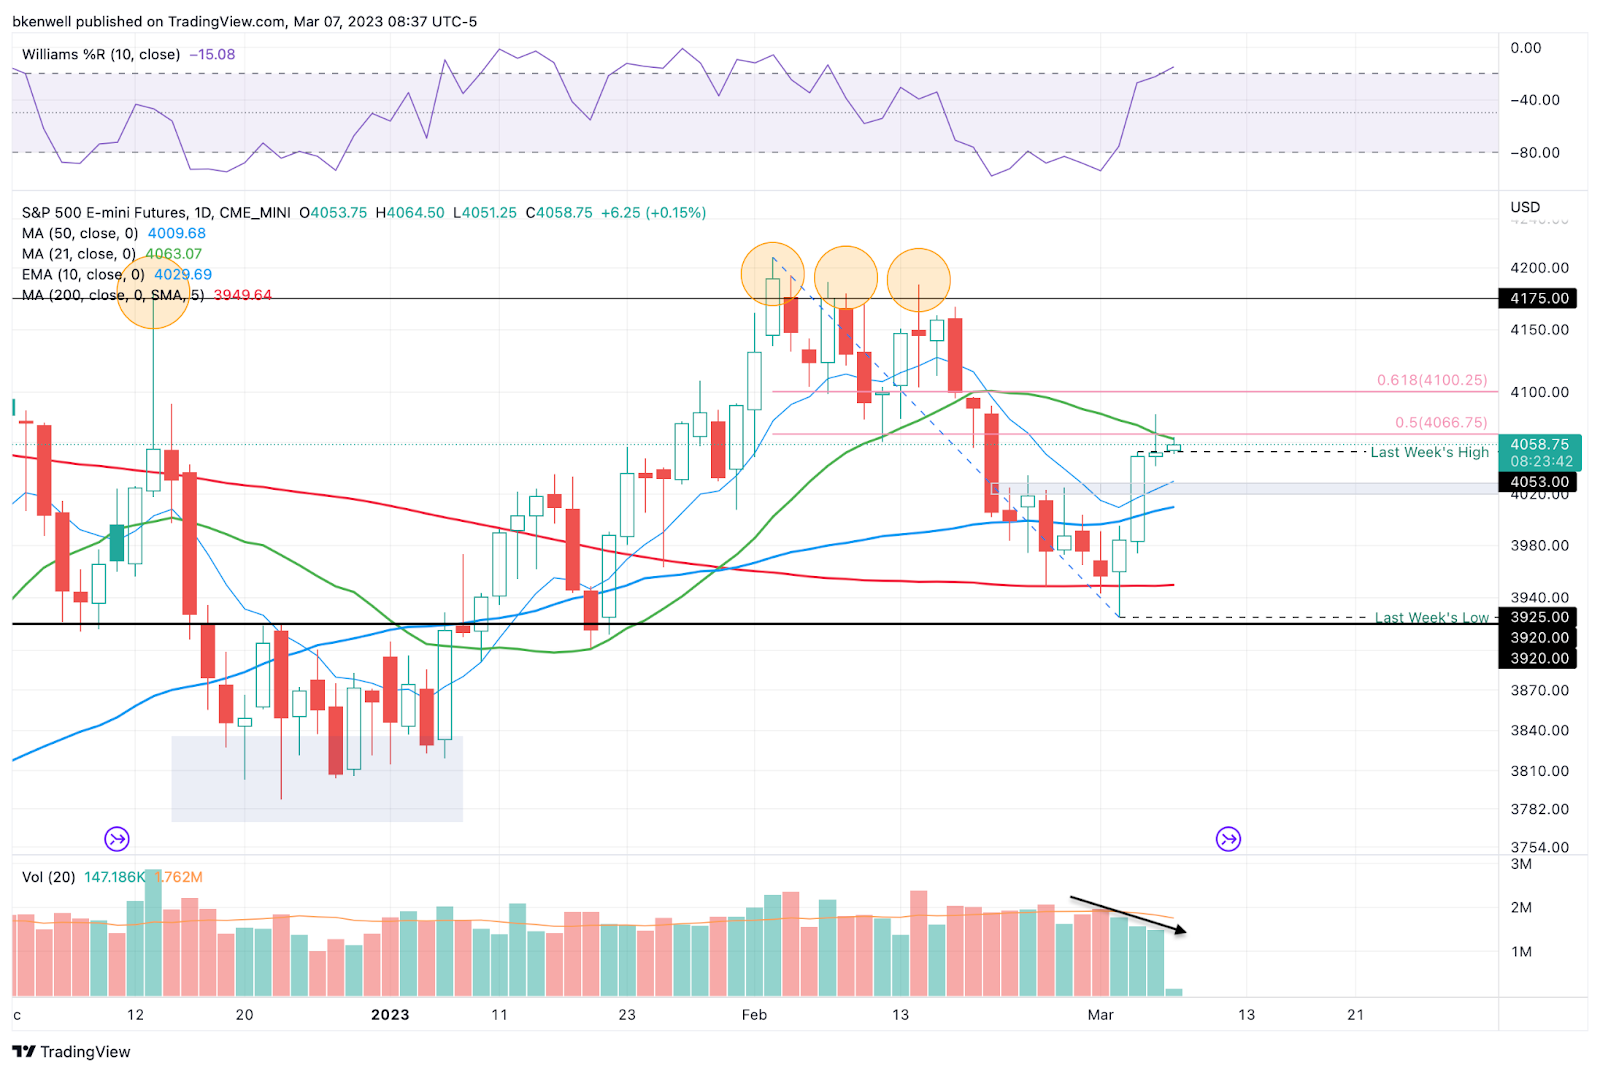
A nice multi-day bounce so far, but what we need is clarity.
Essentially, is this the start of another leg higher or simply an oversold bounce on declining volume and into the 50% retracement of the decline?
From here, look to see if the ES can clear 4067, opening the door to yesterday’s high at 4082.50, then potentially 4100.
On the downside, initial support is down in the 4047 to 4050 area. Below that and the 4025 to 4030 area could be on the table.
SPY
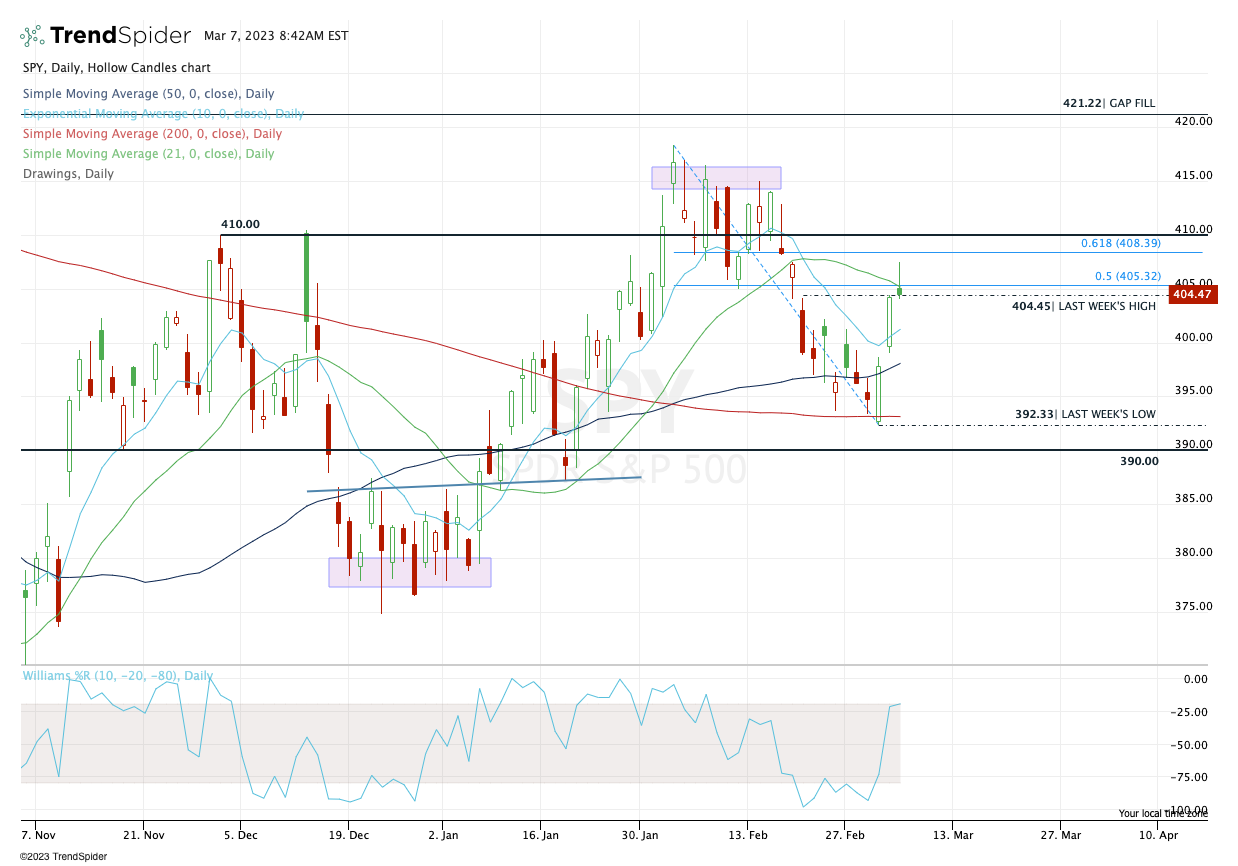
The $404.50 area contains the last two week’s worth of highs and less than a $1 above that is the 50% retrace of the decline. Are we starting to stall out here, giving the bulls false hope of a larger rally?
I wish I knew. While there are concerns to be aware of, the SPY held a key downside level in the low-$390s last week and is bouncing hard.
Keep an eye on yesterday’s low near $404. Daily down below this number could put more weakness in play. Ultimately, bulls will need/want to hold the $400 area. Not only is it psychologically relevant, but it’s where we find the 50% retrace of the current rally and the 10-day moving average.
On the upside, a move over the $407.50 level without a reversal could give us the $408.50 to $410 level.
SMCI

I generally prefer to buy the “reset trade” down to prior resistance + 10-day ema. However, back-to-back inside days does set up a potential rotation trade in SMCI.
Look for a move over $100, with a stop between $94 and $95 and a first target of $104 to $105 (the former being the prior high).
Like AMD, a semi-wide stop, so position size is critical.
CRM

I don’t think we’ll see $178 to $179 today in CRM, but if we do, it’s a BTD candidate. Prior high retest + 10-ema on the 4-hour chart is the catalyst.
Personally, I would like March 17th calls in that scenario, as it limits my risk to the price paid for calls.
Open Positions
-
Bold are the trades with recent updates.
-
Italics show means the trade is closed.
-
Any positions that get down to ¼ or less (AKA runners) are removed from the list below and left up to you to manage. My only suggestion would be B/E or better stops.)
-
** = previous trade setup we are stalking.
-
MRK — Long from ~$110 and now on the verge of monthly-up! — Ideal stop is clearly defined near $105. Initial target for ⅓ trim is $112.50.
-
DD — Long from $72.50. Down to ½ position. Prefer a ⅓ trim at $76.50+
-
Stop at $71 or B/E, whichever you prefer.
-
-
Natural Gas, UNG or /NG — First target hit at UNG ~$10 and NG at 2.95 to 3.00.
-
Now /NG needs to hold the $2.50 mark in order for bulls to stick with this one. If it holds, I would love to see Friday’s highs hit again (the target of our prior trim).
-
-
AMD — I’m in a 40% position as AMD could not close weekly-up — Comfortable with a ~$75 stop-loss as a result of smaller position. Fishing for $84+ as first upside target.
Go-To Watchlist
*Feel free to build your own trades off these relative strength leaders*
Relative strength leaders →
-
NVDA, CRM
-
PANW, FTNT
-
AQUA
-
SMCI
-
WYNN, LVS → would love a reset to the 10-week ema
-
GE → would love a reset to the 10-week ema
-
FSLR
-
AVGO
-
TSLA
-
SBUX, ULTA, NKE
-
AEHR → volatile!
-
MELI
-
AXP → would love a reset to the 10-week ema
-
BA & Airlines — AAL, DAL, UAL
-
CAT
Economic Calendar

No responses yet